This post has been republished via RSS; it originally appeared at: Core Infrastructure and Security Blog articles.
Hello everybody, Simone here to tell you about a situation that happened many times to my customers: understanding how the syslog ingestion works.
To make subject clear make sure you have clear in mind the below references:
- RFC5424 - https://tools.ietf.org/html/rfc5424#section-6.2.1
- https://docs.microsoft.com/en-us/azure/azure-monitor/platform/data-sources-syslog
Most of the time nobody knows what needs to be collected and how hence, with this article, I just want to make some clarification on what is behind the scenes.
Starting from RFC, it is mentioned that we have a list of “Facility” like in the screenshot below:
And for each of them we could have a specific “Severity” (see the corresponding picture below):
Back to the situation, the natural question that comes up is: how can we clearly understand who is using who if we have no information about facilities and severities about related products we are using?
To find the information we need, we must capture some TCP/UDP packets from the syslog server and rebuild the packets in wireshark and then analyze the results.
Let’s start with first step: packets capture. Below you have the macro steps to be followed:
- From the syslog server (in this case a Linux server) we will use the tcpdump command,
if not available follow this link on how to setup
https://opensource.com/article/18/10/introduction-tcpdump - the command could be for example
tcpdump -i any -c50 -nn src xxx.xxx.xxx.xxx (replace with source IPADDRESS under analysis) - the results after the rebuilt with wireshark, should be something similar the following image:
The header of every row contains exactly the information that we are looking for; how to deal with this piece of info? Easy; use the formula contained in the following part directly taken from RFC:
“The Priority value is calculated by first multiplying the Facility number by 8 and then adding the numerical value of the Severity. For example, a kernel message (Facility=0) with a Severity of Emergency (Severity=0) would have a Priority value of 0. Also, a "local use 4" message (Facility=20) with a Severity of Notice (Severity=5) would have a Priority value of 165. In the PRI of a syslog message, these values would be placed between the angle brackets as <0> and <165> respectively.
The only time a value of "0" follows the "<" is for the Priority value of "0". Otherwise, leading "0"s MUST NOT be used.”
In the example above, we have the value of <46>. According to the above-mentioned RFC, the formula used to translate that number into something human readable is the following:
8 x facility + severity
We now must look for the formula result in the following matrix:
|
Emergency |
Alert |
Critical |
Error |
Warning |
Notice |
Informational |
Debug |
|
|
Kernel |
0 |
1 |
2 |
3 |
4 |
5 |
6 |
7 |
|
user-level |
8 |
9 |
10 |
11 |
12 |
13 |
14 |
15 |
|
|
16 |
17 |
18 |
19 |
20 |
21 |
22 |
23 |
|
system |
24 |
25 |
26 |
27 |
28 |
29 |
30 |
31 |
|
security/auth |
32 |
33 |
34 |
35 |
36 |
37 |
38 |
39 |
|
message |
40 |
41 |
42 |
43 |
44 |
45 |
46 |
47 |
|
printer |
48 |
49 |
50 |
51 |
52 |
53 |
54 |
55 |
|
network news |
56 |
57 |
58 |
59 |
60 |
61 |
62 |
63 |
|
UUCP |
64 |
65 |
66 |
67 |
68 |
69 |
70 |
71 |
|
clock |
72 |
73 |
74 |
75 |
76 |
77 |
78 |
79 |
|
security/auth |
80 |
81 |
82 |
83 |
84 |
85 |
86 |
87 |
|
FTP deamon |
88 |
89 |
90 |
91 |
92 |
93 |
94 |
95 |
|
NTP |
96 |
97 |
98 |
99 |
100 |
101 |
102 |
103 |
|
Log Audit |
104 |
105 |
106 |
107 |
108 |
109 |
110 |
111 |
|
Log Alert |
112 |
113 |
114 |
115 |
116 |
117 |
118 |
119 |
|
Clock |
120 |
121 |
122 |
123 |
124 |
125 |
126 |
127 |
|
local0 |
128 |
129 |
130 |
131 |
132 |
133 |
134 |
135 |
|
local1 |
136 |
137 |
138 |
139 |
140 |
141 |
142 |
143 |
|
local2 |
144 |
145 |
146 |
147 |
148 |
149 |
150 |
151 |
|
local3 |
152 |
153 |
154 |
155 |
156 |
157 |
158 |
159 |
|
local4 |
160 |
161 |
162 |
163 |
164 |
165 |
166 |
167 |
|
local5 |
168 |
169 |
170 |
171 |
172 |
173 |
174 |
175 |
|
local6 |
176 |
177 |
178 |
179 |
180 |
181 |
182 |
183 |
|
local7 |
184 |
185 |
186 |
187 |
188 |
189 |
190 |
191 |
So now, let’s make one step back to customer’ question and “guess” what the “Facility” and the “Severity” are in the provided example.
Since header was 46, the result was:
- Facility = message
- Severity = Informational
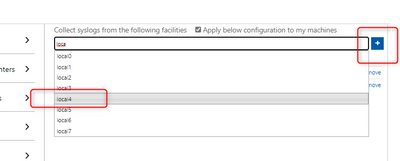
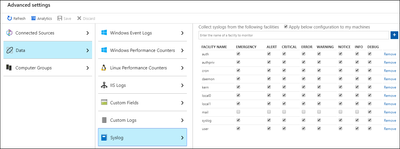
Once we understood what to deal with, it's time to configure Log Analytics / Sentinel enabling the Syslog data sources in Azure Monitor.
All we have to do is to:
- add the facilities (by entering its name and leveraging the intellisense) to the workspace.
- select what severity(ies) to import.
- and click Save.
Using some real-life example, if we want to collect the logs for FTP, the corresponding facility to be entered is “ftp” and the following logs will be imported:
|
Syslog file |
Log Path |
|
|
ftp.info; ftp.notice |
/log/ftplog/ftplog.info |
|
|
ftp.warning |
/log/ftplog/ftplog.warning |
|
|
ftp.debug |
/log/ftplog/ftplog.debug |
|
|
ftp.err; ftp.crit; ftp.emerg |
/log/ftplog/ftplog.err |
|
Differently, talking about Users, the facility is “user” and the imported logs will be:
|
Syslog file |
Log Path |
|
|
user.info;user.notice |
/log/user/user.info |
|
|
user.warning |
/log/user/user.warning |
|
|
user.debug |
/log/user/user.debug |
|
|
user.err;user.crit;user.emerg |
/log/user/user.err |
|
Another one: for Apache, the facility is “local0” and the logs will be:
|
Syslog file |
Log Path |
|
|
local0.info;local0.notice |
/log/httpd/httpd. |
|
|
local0.warning |
/log/httpd/httpd.warning |
|
|
local0.debug |
/log/httpd/httpd.debug |
|
|
local0.err; local0.crit;local0.emerg |
/log/httpd/httpd.err |
|
We have everything in place, but are we really sure that info is produced?
What if you would like to effectively test that data is flowing in the corresponding facility?
We can leverage the following sample commands for CEF & Syslog using the logger built-in utility:
logger -p auth.notice "Some message for the auth.log file"
logger -p local0.info "Some message for the local0.log file"
logger "CEF:0|Microsoft|MOCK|1.9.0.0|SuspiciousActivity|Demo suspicious activity|5|start=2020-12-12T18:52:58.0000000Z app=mock suser=simo msg=Demo suspicious activity externalId=2024 cs1Label=tag cs1=my test"
Note pay attention to time when you query for this result!!! ;)
That’s it from my side, thank you for reading my article till the end.
Special thanks go to Bruno Gabrielli for review
Simone


