This post has been republished via RSS; it originally appeared at: New blog articles in Microsoft Tech Community.
Elasticsearch and Kibana users can now easily migrate to Azure Data Explorer (ADX) while keeping Kibana as their visualization tool, alongside the other Azure Data Explorer experiences and the powerful KQL language.
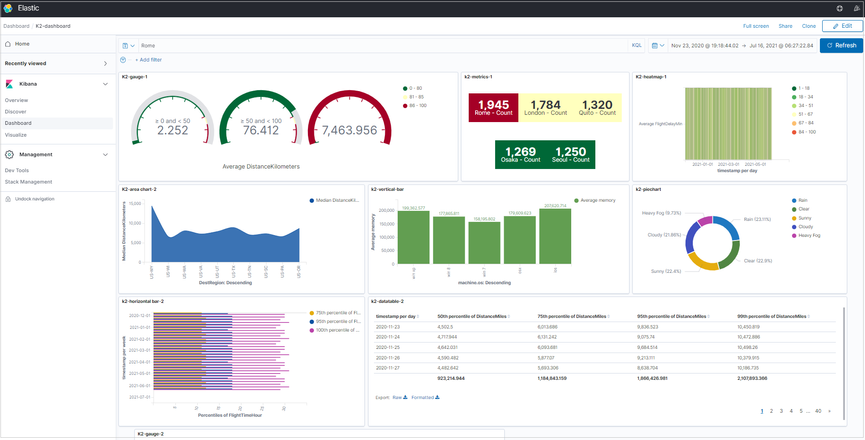
A new version of K2Bridge (Kibana-Kusto free and open connector) now supports dashboards and visualizations, in addition to the Discover tab which was supported previously.
Along with visualizing and creating dashboards, the new version also offers:
- Support of Kibana version 7.10.2, for an improved user experience.
- Improved filtering of Kusto's
dynamicdata type - Enhanced security - it is now possible to authorize the Azure Data Explorer cluster with a system-assigned managed identity, in addition to the previously supported Azure Active Directory (Azure AD) service principal method.
To learn more about Elasticsearch to Azure Data Explorer migration, visit this blog post.

With Kibana's Discover tab, you can search and explore the data, filter results, add or remove fields in the results grid, view record content, and save searches.

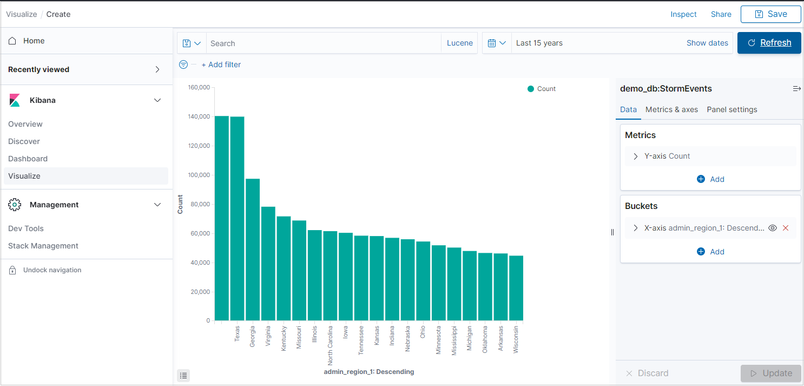
Now, you can create bar charts visualizations by using the Visualize button on the 'top 5 values' pop-up.
You can adjust the metrics (Y-axis) and buckets aggregation (x-axis) from the menu.
Alternatively, you can use the Visualize tab to create other visualizations like Vertical bar, Area chart, Line chart, Horizontal bar, Pie chart, Gauge, Data table, Heat map, Goal chart, and Metric chart. After creating visualizations, you can use them to build dashboards.
Some examples:


Get started today. Install K2Bridge!
You are invited to explore our GitHub repository and install the K2Bridge connector.
To find out more about K2Bridge and the supported visualizations, see the documentation.
You can also view a step-by-step installation video (of the previous K2Brdige version) as part of a Pluralsight free course.
Credits
This project was made possible with the collaboration of the Microsoft CSE (Commercial Software Engineering) group and the Azure Data Explorer team.
What's Next
K2Bridge is a Microsoft open and free project. We welcome your contributions and collaboration!
More details can be found on the contribution section of the GitHub repository.


