This post has been republished via RSS; it originally appeared at: Microsoft Tech Community - Latest Blogs - .
By: Laura Arrizza - Program Manager | Microsoft Endpoint Manager - Intune
Microsoft Endpoint Manager is excited to announce improvements for the Microsoft Intune policy reporting experience that are rolling out with the 2203 service release. We are updating the ‘per-policy’ reporting experience to address common pain points and feedback from customers. These changes leverage the Intune reporting framework, which helps to reorganize how we surface policy reports and provide a better overall reporting experience.
Currently, the latest updates for policy reports apply to the following policy types:
- Device configuration policies (excluding ADMX, DFCI, OEMConfig)
- Endpoint security policies
We will keep you informed as more policy types start to use the updated reporting experience. In this post, we will review the improved reporting experience, and walk through some of the changes we have made across these different report types.
Overview of reporting improvements
Our goal is to give you a powerful, reliable reporting experience that provides an accurate set of rich data to help you manage the policies you have configured in your Intune environment. The new reporting framework offers the following capabilities:
- Data consistency: Ensuring consistent data across all policy reports in Intune, using the same source of truth.
- Better performance: Even in the largest tenants with the largest reports, our new reporting infrastructure lets you quickly generate and consume reports.
- Data representation: Addressing pain points of devices in ‘pending’ state and how we surface device records with multiple user affinities.
- Sleeker design: Updated designs to represent data in a simpler, organized way.
- Navigation tools: We support search, sort, paging, improved export functionality, and filtering controls to get the most out of the data.
- More context for reports: Additional device columns, updated terminology, tooltips, and documentation updates.
Next, we’ll walk through some of these reporting improvements in detail.
A tour of the new policy reporting experience
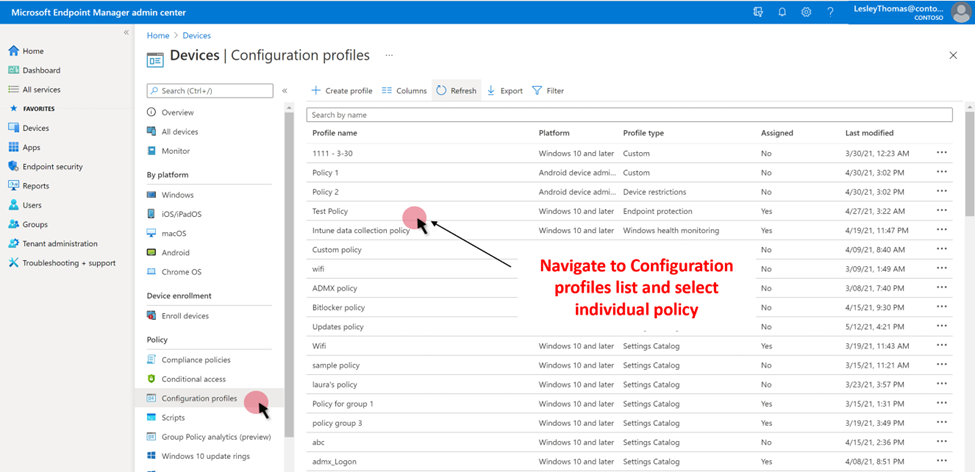
First, navigate to the applicable policy list for either your device configuration or endpoint security policies. In the Microsoft Endpoint Manager admin center, go to Devices > Configuration profiles or the Endpoint security node, depending on the policy type you want to view information for.

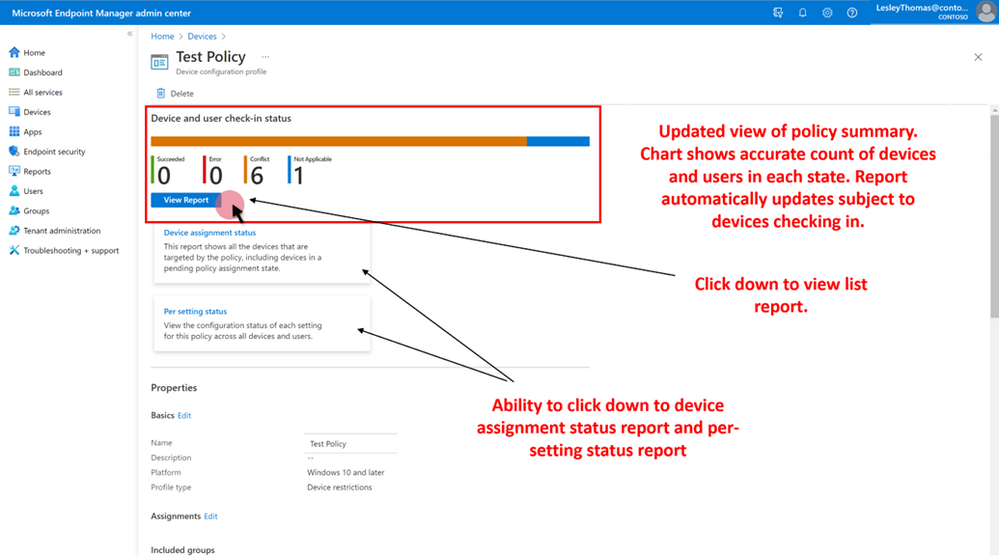
Select the policy to go to the policy overview page. Instead of two donut charts, the new overview page has a simplified, linear aggregate chart that shows the number of device and user check-ins that have reported back in Success, Error, Conflict, or Not Applicable state. The aggregate chart will update as check-ins occur, with improved performance as compared to the previous donut charts. Under the aggregate chart are entry points (cards) to different list reports, as well.
The policy overview page also includes a Properties section with a summary of policy basics, settings, assignments, filters, scope tags, and other information. You can edit these properties directly from the policy overview page.

Continue reading to learn about improvements we’ve made to specific reports.
Device and user check-in status
Select View report to view the Device and user check-in status report, which combines information that was previously split into separate device status and user status reports. This report shows the list of device and user check-ins for the policy, with the check-in status and last check-in time (based on the reported policy check-in time). When you open the report, the aggregate chart will remain at the top of the page, and the data will be consistent with the list data. Use the filter column to view assignment filter options. You can also view additional columns for device properties in the report: Model, Manufacturer, Intune device ID. Tools are available to search across the entire dataset, sort on every column, use paging controls to navigate through data, view number of records within the report. We have improved export functionality when saving information to a .csv file, including applying filters to the exported data and an overall quicker export process.

If you select one of the device and user entries, it will drill down into the list of settings applied to the device/user from the policy. From here, you can view the settings and setting status to see more details on errors and conflicts. This is the same view as is reflected in other areas of the UI.

Device assignment status
We also have a brand-new Device assignment status policy report, which surfaces data on the latest status for assigned devices from the policy. To go to this report, select the Device assignment status card on the policy overview page. By default, the report will return empty until you generate the report with or without a filter for the assignment status. Once completed, the report will include a timestamp for when it was last generated. The reporting data will be available for up to three days before needing to be generated again.
Like the Device and user check-in status report, the Device assignment status report page includes an aggregate chart that summarizes the list data. The aggregate counts the number of device check-ins based on the last active user across Success, Error, Conflict, Not Applicable, and Pending states. A denominator shows the total count of assigned devices and primary users targeted by the policy. The list records reflect the same data, surfacing only one entry per device based on its last active user.
Like the previous report, we have included additional device columns, tools to navigate throughout the records, the ability to drill down to the settings view, and added context on reports.

This new report includes improvements to address two previous pain points:
- Reducing duplicate device entries – The report ‘flattens’ device entries to the last active user. Previously, customers might have seen multiple entries for devices that reflected both a ‘system account’ and ‘user account’ as the last signed-in user.
- Improved definitions of ‘Pending’ state – We have improved the way we determine a device to be in a ‘Pending’ state. When a device state is pending, it means it has not reported back what the status is for applied policy settings. At this point, it is unknown which user is associated with the device, so the user field will be empty. This state is consistent across the Intune UI.
Per setting status
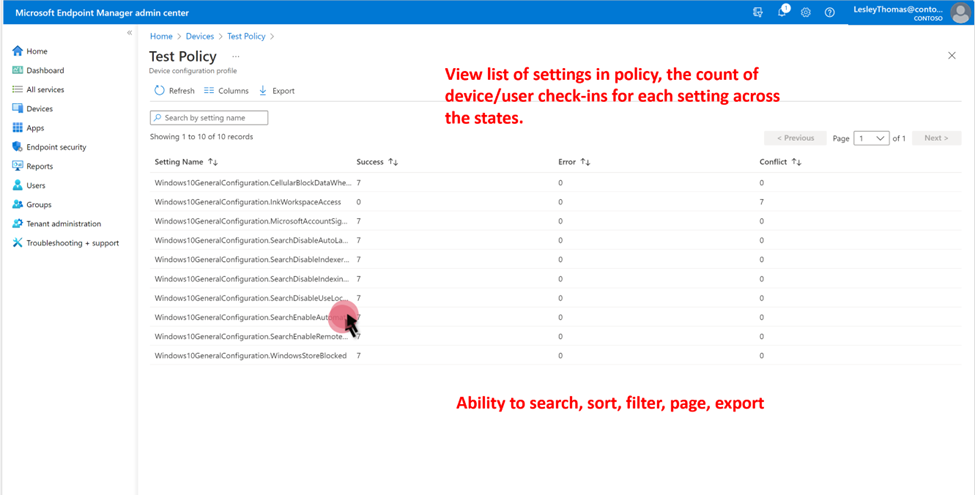
The Per setting status report surfaces the summary of device and user check-ins that are in Success, Conflict, Error states at the granular setting level within the policy. This report leverages the same consistency and performance updates as well as navigation tools we’ve made available to other reports. To go to this report, select the Per setting status card on the policy overview page.

Certificates
For applicable policy types, the Certificates report is available to show certificate-related data for the policy.
The same data will be reflected in the ‘per device’ report which is available by navigating to Devices > All devices > select device > Device configuration to ensure data consistency.

Common questions
Will I lose any data with these changes?
The reporting changes will have no impact on existing data. The same information from before is available at parity, plus more.
What about Microsoft Graph API endpoints?
New Graph API endpoints are available using updated reporting experience. Existing Graph API endpoints will stay intact. We suggest you move any automation over to using updated endpoints:
List of settings by category
|
Report name |
Updated Experience APIs |
Older Experience APIs |
|
Device and user check-in status (Summary) |
/deviceManagement/reports/getConfigurationPolicyDeviceSummaryReport |
deviceManagement/deviceConfigurations/{id}/deviceStatusOverview
deviceManagement/deviceConfigurations/{Id}/userStatusOverview |
|
Device and user check-in status (List Report) |
/deviceManagement/reports/getConfigurationPolicyDevicesReport |
|
|
List of settings for Device/User Record via Device and user check-in status |
/deviceManagement/reports/getConfigurationSettingNoncomplianceReport |
N/A |
|
Device assignment status (Summary) |
/deviceManagement/reports/cachedReportConfigurations('DeviceAssignmentStatusByConfigurationPolicy_{id}') , /deviceManagement/reports/cachedReportConfigurations , /deviceManagement/reports/getCachedReport |
N/A |
|
Device assignment status (List Report) |
/deviceManagement/reports/cachedReportConfigurations('DeviceAssignmentStatusByConfigurationPolicy_{id}') , /deviceManagement/reports/cachedReportConfigurations , /deviceManagement/reports/getCachedReport |
N/A |
|
List of settings for Device/User Record via Device assignment status |
/deviceManagement/reports/getConfigurationSettingNoncomplianceReport |
N/A |
|
Per setting status (List) |
/deviceManagement/reports/getDeviceConfigurationPolicySettingsSummaryReport |
deviceManagement/deviceConfigurations/{id}/deviceSettingStateSummaries |
|
Device configuration (List Report) via Device Object |
/deviceManagement/reports/getConfigurationPoliciesReportForDevice |
https://graph.microsoft.com/beta/deviceManagement/manageddevices('{deviceid}') |
|
List of settings for Device/User Record via Device object |
Device Configuration profile types: /deviceManagement/reports/getConfigurationSettingNoncomplianceReport
Settings Catalog and Endpoint Security profile types: /deviceManagement/reports/getConfigurationSettingsReport |
N/A |
|
Assignment failures |
/deviceManagement/reports/getConfigurationPolicyNoncomplianceSummaryReport |
N/A |
|
List of Devices/User Records via Assignment failures report |
/deviceManagement/reports/getConfigurationPolicyNonComplianceReport, |
N/A |
|
List of settings for Device/User Record via Assignment failures report |
Device Configuration profile types: /deviceManagement/reports/getConfigurationSettingNoncomplianceReport
Settings Catalog and Endpoint Security profile types: /deviceManagement/reports/getConfigurationSettingsReport |
N/A |
How are reports generated for different device types and user affinity types? Why do I see ‘system account’ users?
Policy reports are generated based on the context of a user check-in for a device. For example, in cases of a physical device with primary and secondary users, the last active user will likely be a user account. However, for Windows Autopilot devices, inactive users, or helpdesk sign-ins to a device, the last active user may show as the ‘system account’. Note, when a user signs in to a device that they are not assigned to or the primary user for, this entry will not be surfaced.
What other reporting changes are on the roadmap?
- Enable for government cloud environments
- Move all policy types to new experience
- Improving error codes and conflict resolution
- Innovation in new reports
Summary
We hope you are as excited as we are about these improvements, and we encourage you to check out these new changes in Intune. For details on past changes we’ve made, see Introducing New Policy Reports & more in Microsoft Endpoint Manager Reporting and Microsoft Intune announces powerful new reporting framework. Stay tuned for updates on further improvements to Intune reporting. If you have any feedback or questions, leave a comment below or reach out to @IntuneSuppTeam on Twitter.
