This post has been republished via RSS; it originally appeared at: Microsoft Tech Community - Latest Blogs - .
When we use Azure Cloud Service to host websites or proceed some data process, it’s always better for developers and service providers to have a way to monitor the service status, usage and other metrics. Application Insight is a such kind of official tool provided and supported by Azure. In this blog (part 1), we’ll mainly provide some guidelines on how we can use Application Insight with Cloud Service and talk about the basic features which we can use in Application Insights. The common scenarios regarding the Diagnostic setting and troubleshooting will be included in part 2 of this blog. (Coming soon)
In this blog, Cloud Service stands for both classic Cloud Service and Cloud Service Extended Support because the Application Insight works on both of them in same way.
This blog will contain the following parts:
- How to configure Application Insight in Cloud Service project
- How to check the failed requests of Cloud Service WebRole
- How to check the request summary of the Cloud Service WebRole
- How to configure an alert in Application Insight based on metrics data of Cloud Service
- How to check the metrics chart in Application Insight
- How to check the collected log in Application Insight
Pre-requisites:
Before starting, we need to have the following resources created in your Azure subscription:
- One Cloud Service resource
- One Application Insight resource for each role of your Cloud Service
- One Storage Account
Although it’s not necessary, it’s still recommended to create all the resources in the same region. About how to create them, please kindly check related official documents: classic Cloud Service or Cloud Service Extended Support, Storage Account and Application Insight.
How to configure Application Insight in Cloud Service project
Here is an existing official document talking about this. But since it isn’t so clear, for the basic features of Application Insight, you can also follow this simpler version:
Please kindly set Application Insight and enable Diagnostic on each Cloud Service role as described in official document. When we enable the Diagnostic of Cloud Service role, please also remember to set up a storage account. This storage account will also be used to store the diagnostic data and log files. For Cloud Service Extended Support, the options to select Application Insight will not appear until we select the Storage Account.
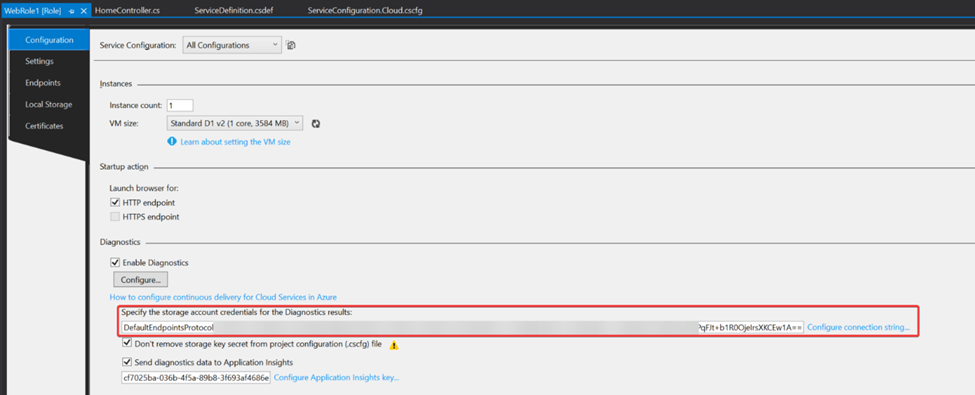
P.S. For Cloud Service Extended Support, we can also enable the Diagnostic setting and Application Insight by PowerShell and ARM template. But with that way, we may need some additional manual configuration file changes such as SinksConfig in PublicConfig of the Diagnostic Setting. If you're interested in that way, please kindly refer to document of Cloud Service Extended Support WAD extension and Application Insight setting in Diagnostic setting.
How to check the failed requests of Cloud Service WebRole
In Application Insight, all the failed requests with unhandled exceptions will be collected and displayed in Failures page. Please pay attention to the time range which you selected. Many users were unable to get correct data because they selected the wrong one between UTC and local time.
The example project here was the default WebRole MVC model project which everyone can create in Visual Studio. The only difference is the added calculation of 100/0 which will cause System.DivideByZeroException when the page About is loaded in HomeController.cs file in Controllers folder.

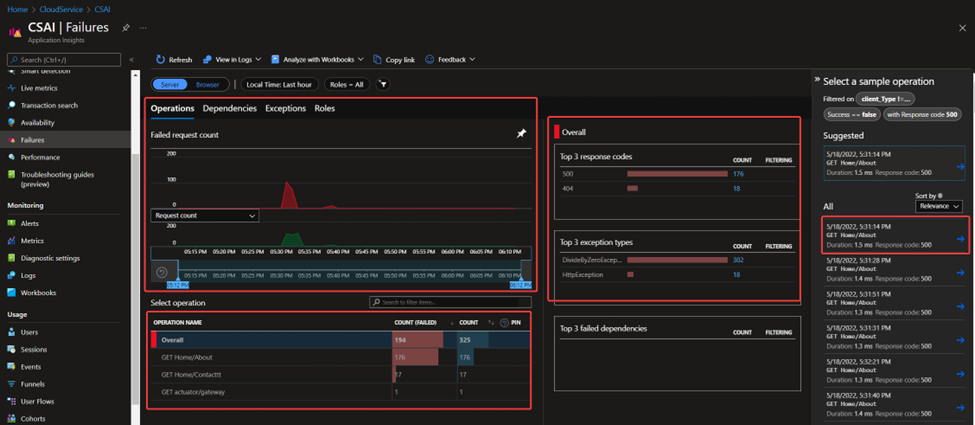
In this Failures page, there is much information, such as:
- Failed requests count chart on top left side
- Different failed request count on bottom left side (Here there is only one because my example only has one unhandled exception)
- The most failed response code count and most exception types count on right side
If we click on a specific operation name, it will return a list of all failed response code and exception type on the right side and if we click on the failed response code or exception type, it will return a list of all failed request records mapping the condition we selected.
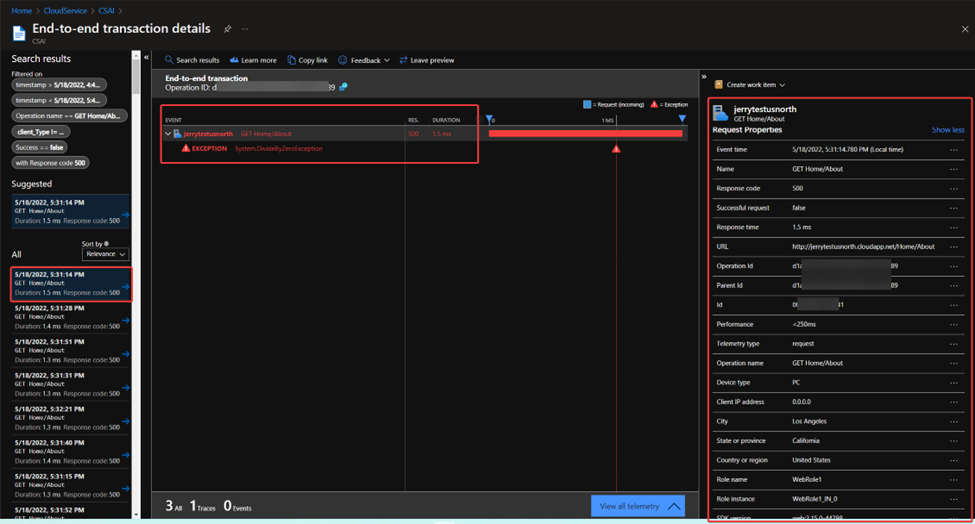
Then in real scenario, when the developers found that there was unhandled exception, except monitoring the amount, they will also need to fix it. When we click on one specific failed request, the following page will be returned. In this page, it contains two parts.
The left-side part is a transaction roadmap of the request. It will return the information such as exception name, performance time used by every step.
The right-side part is with more details of this failed request which are very useful for troubleshooting, such as:
- The timestamp of the request
- The response code
- The response time
- The operation name, which normally contains the HTTP Method and URL path
- The instance which this request is handled by
- The SDK version
- Etc.
Besides the above information, if we scroll down the right-side part, it will also provide the complete Callstack of the failed request.
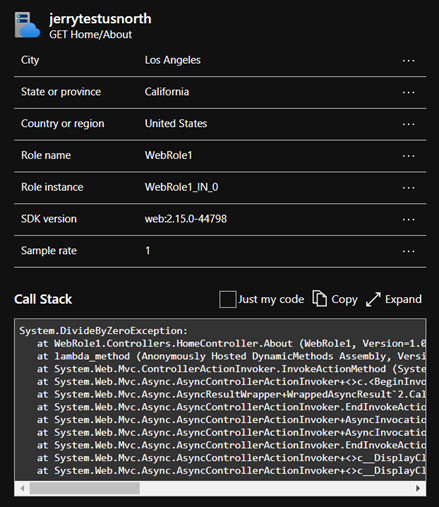
The above information will be quite useful when we need to troubleshoot an intermittent issue and locate the part of code where the error is thrown out from.
How to check the performance summary of Cloud Service WebRole
For the WebRole, the data which we can check in Performance page can be grouped into 2 parts:
- How many requests that the Cloud Service handled during time unit and the response time of every handled request
- The performance data such as CPU, Memory, Disk IO, Network IO of the Cloud Service server
Again, as Failure page, we need to pay attention to the difference of UTC and local time.
In the Operations page, we can see three different charts.

- The top-left side is for how many requests that the Cloud Service handled. The line chart on the bottom side of this figure is for the request count and the dot chart on the top side is for the average response time of the handled requests.
- The bottom-left side is the summary of the handled requests. It will be grouped by the operation name, which normally contains the HTTP method and the function name in controller (if it’s MVC based) and it will also provide the average response time and count of the specified operation type. All the handled requests, including both successful and failed, will be displayed here.
- The top-right side is the chart for the distribution of the response time of handled requests. The ordinate is the request count and abscissa is the response time.
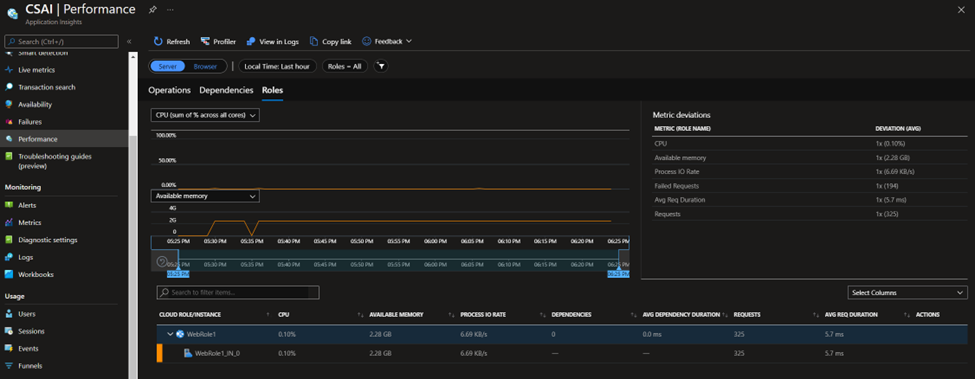
In the Roles page, it will show us the metrics data more related to the Cloud Service server, such as CPU, Available Memory, the requests handled by each instance etc.
How to configure an alert in Application Insight based on metrics data of Cloud Service
It’s impossible for developers or managers to monitor the status of the Cloud Service 24*7. It will be very helpful if the monitoring system can automatically send notification to user when the metrics data is abnormal, such as too many failed requests or too high CPU, or even do some automatic mitigation actions if it’s configured.
Since there is an official document about how to use alert feature of Application insight. Here we’ll give some simple explanations and an example. For more details about this feature, please kindly refer to the document.
The alert is a feature which allows users to set custom rules. These rules mainly contain two important parts: conditions and actions.
1. In the Alerts rule of the Application Insight resource, we are able to see all triggered alerts, menu button to create new Alert rule and menu button to check all existing alert rules.
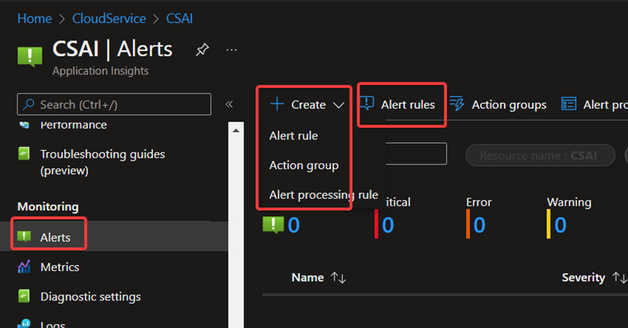
2. The first thing of creating an alert rule is to set up the conditions. Normally the condition will consist of three points: Signal, dimension and alert logic. For detailed explanation, please refer to this document.
- Signal is the type of the metrics data which the alert rule will monitor. The common metrics data, such as CPU, available memory, failed requests, exceptions even the response time can be used. In the example, the failed requests is used.
Signal setting of Alert Rule
- Dimension is the one to specify the scope or filter where this alert rule will use. For alert rule based on Cloud Service metrics data, it will usually contain two possible dimension choices: Cloud role instance and Cloud role name. In addition to these two dimensions, there will also be some other specific choices depending on the signal.
In the example, for failed requests, Cloud role instance and Cloud role name will be the scope to limit the metric data to be monitored. The data should be from specific role or role instance. Result code, request performance and is traffic synthetic are the filters to filter the metric data
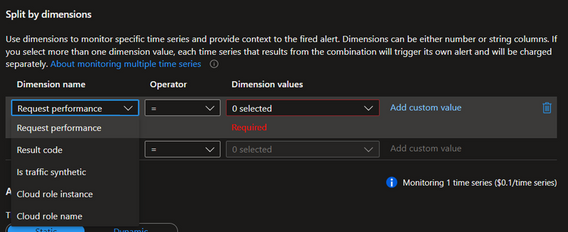
P.S. This dimension should only be modified only when you want to set a specific dimension, such as only want to monitor the specific instance of a role. Otherwise, it’s recommended to keep it as:

- Alert logic, as the name, is the part where we should set the logic of the alert rule condition. In this part, we need to understand multiple points:
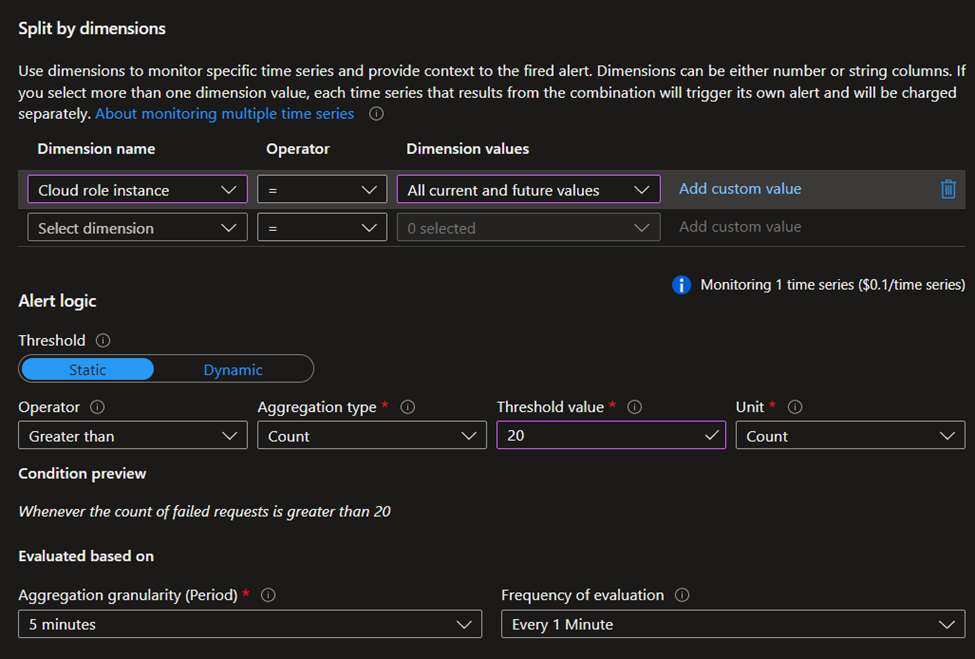
- Threshold means whether the evaluation result is dynamic or static. If it’s static, then the evaluated metrics data, failed requests count in this example, will be compared to a static value, such as 5 or 10. If it’s Dynamic, then the evaluated data will be compared to the same data in last little time such as last 5 minutes.
- Operator, Aggregation type, Threshold value and Unit are easy to understand. It’s like the main body of logic.
- Aggregation granularity, also called period, is how long the metrics data in history will be evaluated. If it’s 5 minutes, it means the metrics data of the last 5 minutes will be evaluated.
- Frequency of evaluation means how often the evaluation will be triggered.
For example, if we want to monitor the failed requests in whole Cloud Service every 1 minute, and once the failed request of last 5 minutes is more than 20, then the alert will be triggered, the alert rule condition will be like:
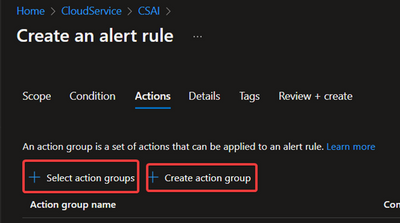
3. The next step is to set the action which Application Insight will do when the Alert rule is triggered. Here we need to create a new action group and add it into this alert rule, or we can use an existing action group.
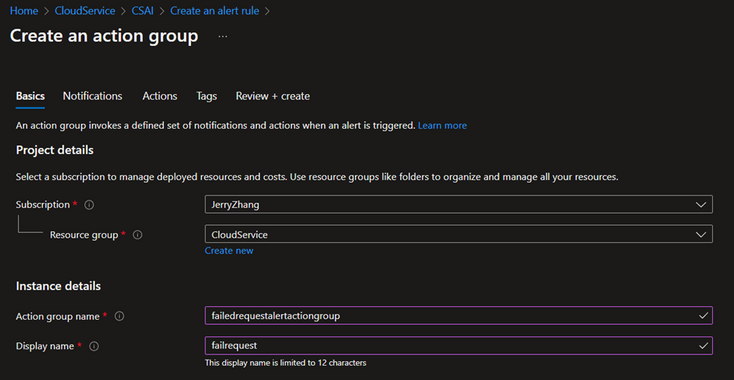
- Select the subscription and resource group where the action group resource will be created and give name and display name.
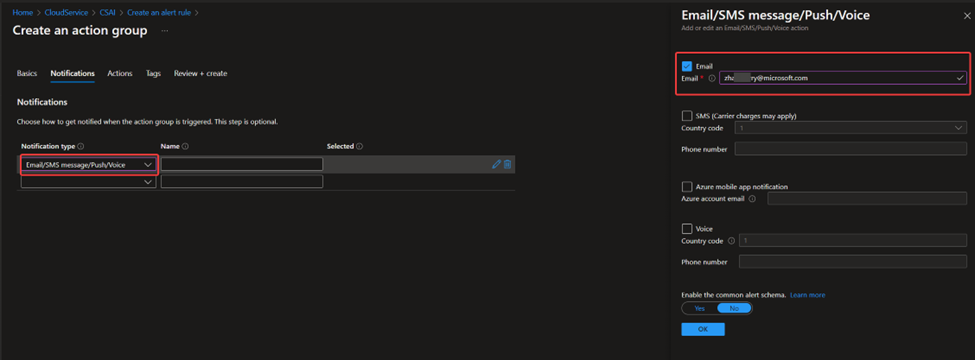
- Select how the user will be informed when the alert rule is triggered. In example, I selected the email to my email address. Please remember that this step is optional since we can only require Application Insight to automatically trigger other services to run the configured script.
- Select what action it will take. We can trigger Automation Runbook, Azure Function and other 5 service types in this option. And also, this is optional, as Notifications. In this example, I don’t build another service system for this feature otherwise it will be too complicated

Once the action group is created, it should automatically be added into the alert rule.
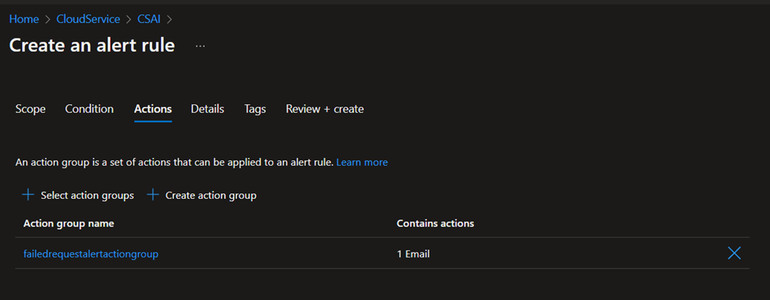
4. In the Details page, we need to select the subscription and resource group where the alert rule will be created and set its name and severity level.
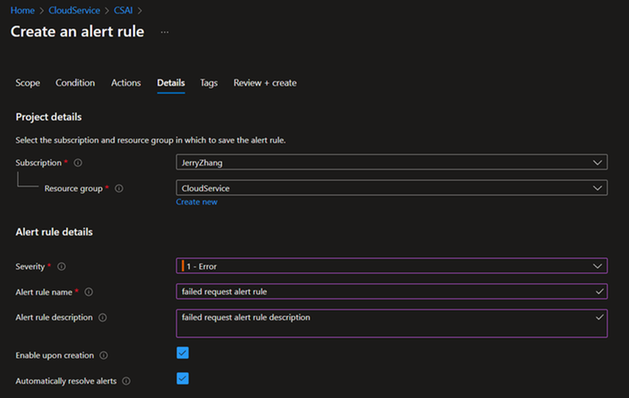
Once the alert rule is created, it can be enabled, disabled and deleted.

Now if we triggered any failed request on Cloud Service more than 20 per 5 minutes, the alert rule will be triggered, and email will be sent to me.
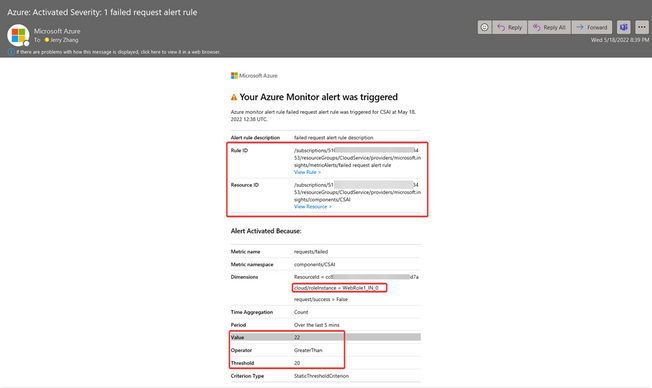
How to check the metrics chart in Application Insight
When we monitor the usage of our Cloud Service, sometimes the default chart in Performance page is not clear enough or it doesn’t contain a specific type of data. Then the Metrics chart will be useful at this moment. It can generate a chart per configuration and display the data in a user-friendly way.
If we look at the Metrics page of Application Insight, there are a few important configurations which we need to understand at first:

1. Chart type: The type of chart which you want to see. Possible options are Line chart, Area chart, Bar chart, Scatter chart and Grid.
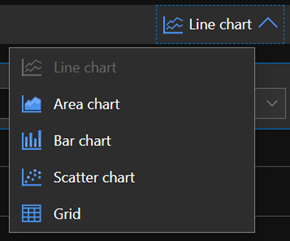
2. Time range: The time range of the metrics data to generate the chart. Please also pay attention to the difference between local time and UTC.
3. Metric Namespace: The group of possible metrics data. Normally we only need to select between Log-based metrics and Application Insights standard metrics. All data which will be collected by default, such as CPU, Memory, requests, exceptions etc. will be in Application Insights standard metrics. Some more specific data collected by customized setting, such as the processor time of w3wp process (which can be configured in Diagnostic setting of Cloud Service), will be included in Log-based metrics.
4. Metric: The data which we want to generate chart for.
5. Aggregation: Type of statistic calculated from multiple metric values. For more details, please check in this document. It’s strongly recommended to keep this as default value. Please only modify it when you understand well how this metrics data type is collected and understand well the difference among all aggregation types.
After selecting all above options correctly, the page will automatically generate and return the chart to you. The following example is the Processor Time of w3wp process.
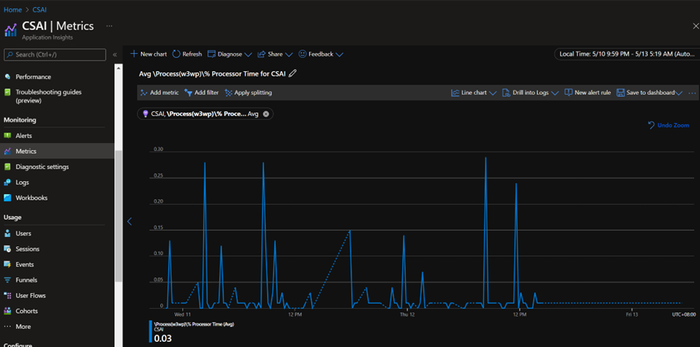
P.S. The dotted lines in the chart mean that the data during that time range is not accurate enough or is not collected. The reason is the data during that period is not continue. Imagine that when the metrics data is collected every 2 minutes but the time difference between two points in chart is 1 minute, the data will be not accurate enough to generate the chart so it will be dotted line.
How to check the collected log in Application Insight
Almost all Application Insight features presented above are all based on the data collected as log. It’s also possible for users to check these logs directly to get more detailed information which is not shown in other pages.
When we open the Logs page of the Application Insight page, we’ll see a window as following:
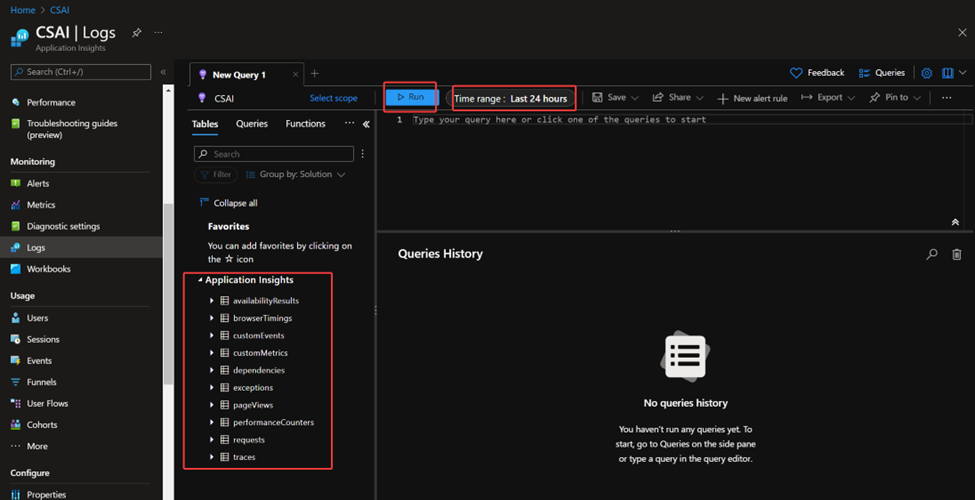
In this page, we need to write some custom query to filter the collected logs and get needed information. The query which we will use is the Kusto query. It will be easy for everyone with experience of SQL or other Query language to use since it’s quite similar.
So here there are only two points which we need to pay attention to: the time range and the query we use.
As the name suggests, the time range on the top side can set the time range of the logs which we want to check. For example, if we know the almost timestamp of the failed request, then we can set the time range more accurately to speed up the query process. Also please remember to pay attention to the difference between local time and UTC.
Here is one simple query as example:
exceptions
| where * contains "Zero"
To write a Query, there are still two points which we may think about: Table name in first line and condition which we use to filter the results. Since the different type of metrics/log records will be saved into different tables, it’s impossible for us to get the data from wrong table.
Here we only include the usually used tables. The relationship of the data and table name is:

And there are some tables which will be responsible to save the data collected by custom Diagnostic setting.

After clarifying the data collected by each table, we need to look at the filters. Here are some often used filters: (xxx stands for a column name. If we do not know specific column, we can use * to stand for all columns.)
1. | where xxx contains “specific words”
This filter can be used to look for the results containing specific words. For example: Get all exceptions having keyword Zero.
exceptions
| where * contains "Zero"
2. | where xxx == “specific words”
This filter can be used to look for the results with a specific value as the value of a column. For example: Get all requests with 200 as response code.
requests
| where resultCode == "200"
3. | order by timestamp desc
This filter can be used to order the results by timestamp. The latest result will be at top.
4. | summarize by count() by xxx
This filter can be used to get a summary of the results by a specific column. For example, the query to see the response code amount.
requests
| summarize count() by resultCode
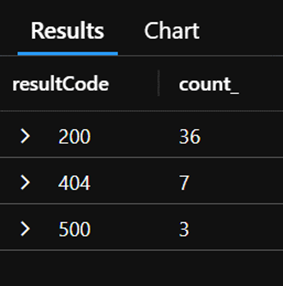
One more point is that some filters can be used together. For example:
requests
| where resultCode == "200"
| order by timestamp desc
Summary
The above tips explained how we can basically use the Application Insights with Cloud Service and how to check collected data in Application Insights. In next part, we'll talk more about the real and common scenarios how we can use Application Insights to help the troubleshooting on application issue.
