This post has been republished via RSS; it originally appeared at: Azure Data Explorer Blog articles.
Using Field Parameters with Kusto data
Field parameters are a new feature in Power BI as of the May version.
With field parameters you can give the consumer of a report a lot of flexibility about the content of the report, what fields are used in the visuals, what time granularity is used and what measures are displayed.
All this without writing any DAX or M code.
In the attached example you can see additional use of field parameters left for you to figure .
Getting the data into Power BI
Start by connecting to the Azure Data Explorer (Kusto) connector and using the help cluster.
The help cluster is open for anyone and you don’t need any special account to use it.
Don’t forget to scroll to the bottom of the dialog and check Direct Query
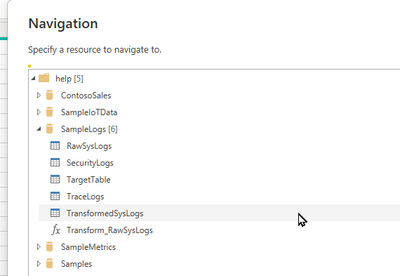
Once in navigation you want to select the table TraceLogs in the database SampleLogs
Select Transform Data and you are in the Power Query editor
The table contains a log of ingestion files into Kusto back in one day in 2014.
We need to filter rows that contain Ingestor_executer in the component column.
An important column to look at is the properties column which is a JSON contain detailed information about each ingested file: Size, Format , CPU, Duration and more.
We want to use these values in the report, so we need to extract them from the JSON.
The JSON structure is stored in a string column so we need to first cast it to a dynamic type and then extract the elements from it.
We can use an M function to insert a KQL snippet as part of the query
We start by inserting a new step
The new step is created in this way
Now you can edit the statement in the formula bar and eventually it will look like this:
= Value.NativeQuery(#"Filtered Rows","| extend D=todynamic(Properties) | extend Size=D.size,Format=tostring(D.format),Rows=tolong(D.rowCount)")
We also would like to have columns for different time granularity like Hour Minute and second
We can create them using Power Query features but as we already use the Value.NativeQuery function , we can add some more columns.
| extend Hour=bin(Timestamp,1h), Minute=bin(Timestamp,1m),Second=bin(Timestamp,1s)
Now we can delete the columns properties and D and apply
The actual columns we need are:
Adding field parameters
You need to enable the feature in Options/preview features
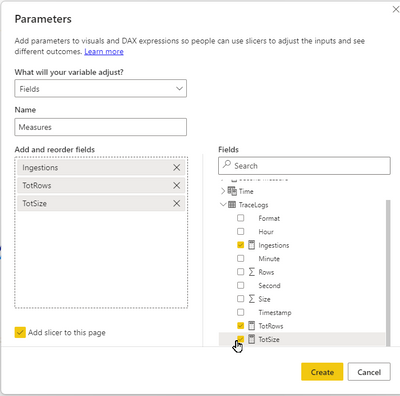
First we create three Dax measures for Ingestions total size and total rows.
Now you can use modeling / New parameter / Fields
Create a new field called Measures
We can use this field to enable selection of the measure in a visual.
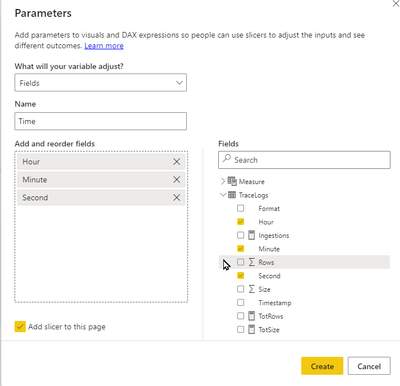
Add another field parameter to select the time granularity with the Hour, Minute and Second
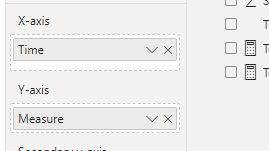
Now we can create a line chart that will use the parameter fields
When selecting values from the measure and Time slicers, the chart is changing and all this, with very little effort and no sacrifice of performance.


