This post has been republished via RSS; it originally appeared at: Microsoft Tech Community - Latest Blogs - .
We are excited to announce the Public Preview for Azure Monitor managed service for Prometheus!
Prometheus, the open-source project from the Cloud Native Computing Foundation, is considered the de-facto standard when it comes to monitoring containerized workloads. Running self-managed Prometheus is often a great solution for smaller deployments but scaling this to handle enterprise workloads can be a challenge.
Azure Monitor managed service for Prometheus brings the best of what you like about the open-source ecosystem while automating complex tasks such as scaling, high-availability, and long-term data retention. It is available to use as its own feature from Azure Monitor or as an integrated component with Azure Monitor container insights and Azure Managed Grafana.
How it works
Azure Monitor managed service for Prometheus offers fully managed collection, storage, rule evaluation, and querying of Prometheus data. The metrics time-series database leverages the same platform used by Azure Monitor Metrics, which we extended to handle Prometheus metrics in their native format. This approach provides customers with all the benefits that come from an established metrics platform such as performance, high-availability, built-in scaling, global reach, compliance, and capacity while providing Prometheus compatible interfaces for querying and interacting with the data using PromQL.
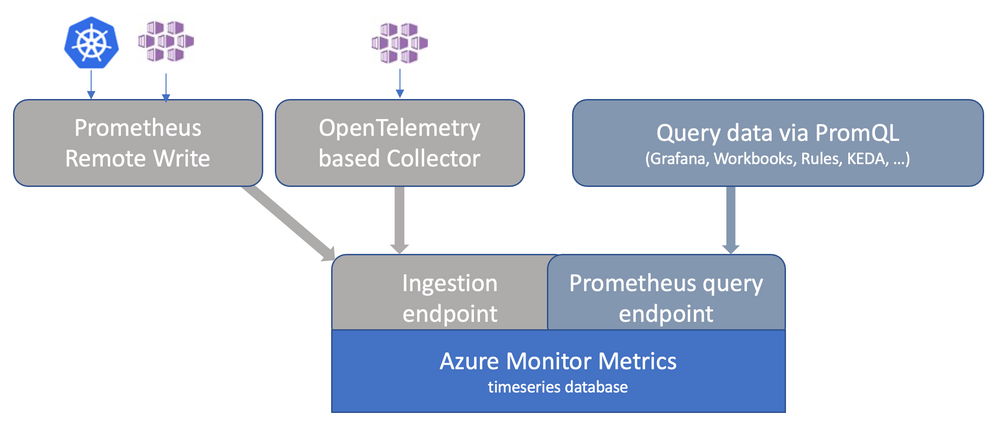 Azure Monitor managed service for Prometheus overview diagram
You can choose to use Azure Monitor managed service for Prometheus to replace your self-managed Prometheus environments or as remote storage option for them. Using our remote write interface allows you to continue using self-managed Prometheus where it makes sense, but get benefits from our managed service to address the pain points related to high-availability, scaling, monitoring across clusters and providing long term data retention.
Azure Monitor managed service for Prometheus includes a ruler service which supports Prometheus alert rules and recording rules based on PromQL queries. New metrics created by recording rules are stored back into the metrics database. Once an alert is fired, it is visible in the Azure portal, like other Azure alerts. Managed Prometheus alerts can also trigger actions or notifications of your choice, as defined in Azure action groups that are configured in your alert rule.
High availability and scaling
Our managed service helps address your need for high availability and scaling in multiple ways. Our managed collector can be enabled in its default mode running as a replica set or in "advanced mode" where the collector runs as both a replica set and on each node. Advanced mode is recommended for clusters with more than 50 nodes or 1500 pods.
Data is then routed to our highly available ingestion endpoint and then stored in our Prometheus-compatible timeseries database. The data is automatically stored in the region you selected when enabling Managed Prometheus as well as in a paired region in the same Geo. When querying the data from our Prometheus compatible HTTP API, we automatically route the queries to the primary data store and will automatically move to the secondary store as needed.
With regard to scale, Managed Prometheus starts with a default limit of 1 million active time series but we can increase this limit to handle in excess of 25 million active time series when requested.
Cross cluster analysis
When setting up Managed Prometheus, you can choose how you would like to manage your cluster data. In general, we see customers using a single Managed Prometheus per region to store the data for all of their clusters in that region. This allows you to create cross cluster dashboards in Grafana. When defining recording and alert rules, you can choose to have them scoped to data from a single cluster or scoped globally across all cluster data in your Managed Prometheus resource.
Long term data retention
Would you like to analyze and report on Prometheus data from weeks or months ago? We have you covered. Managed Prometheus includes 18 months of data retention. This is included as part of the service and there is no additional charge for storage and retention.
Easy to get started
It is simple to get started. Search for “Managed Prometheus” in the Azure Portal, click on the result in the Services section, and within a few steps you will be up and running.
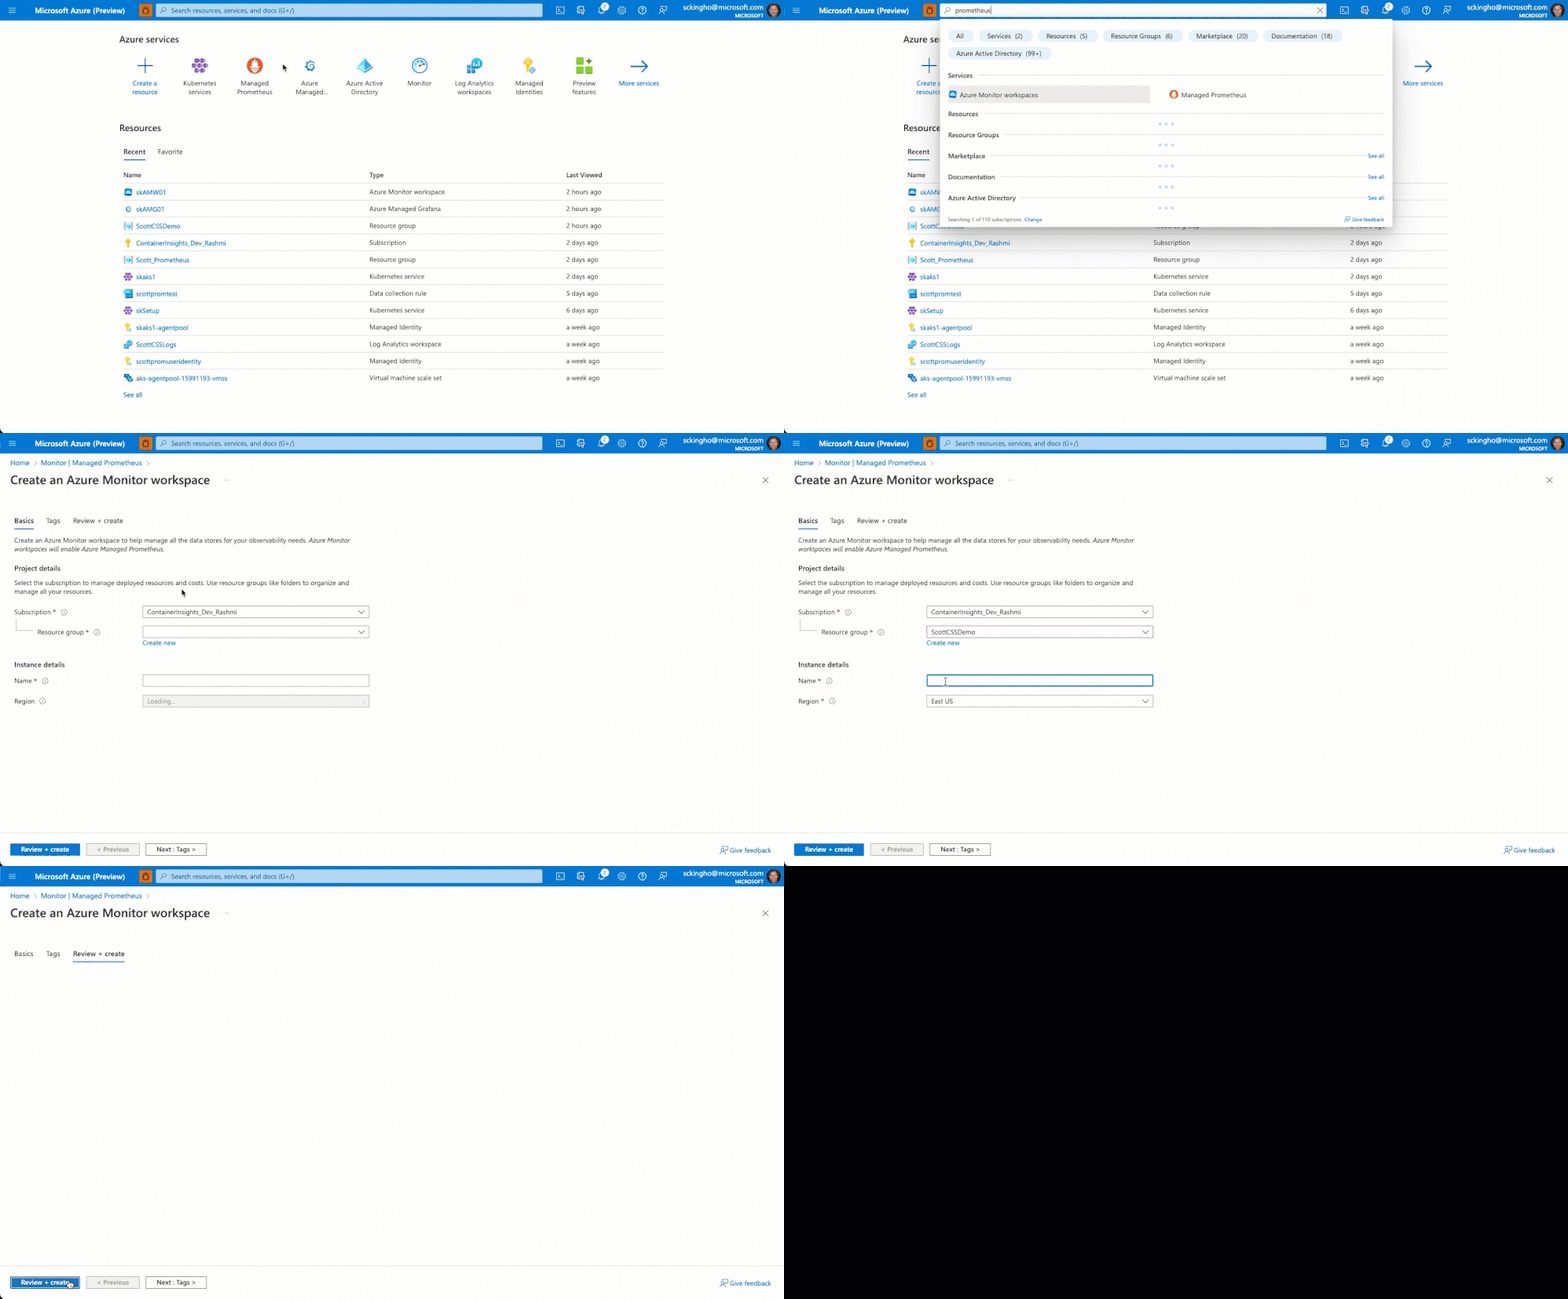 Find and setup Azure Monitor managed service for Prometheus
Once you have onboarded you can configure your Azure Kubernetes Service clusters to collect and send data to your Managed Prometheus resource. Our managed add-on for Azure Kubernetes Service scrapes the endpoints on your clusters and routes the data to your Managed Prometheus. While configuring your cluster, we also make it easy to setup your Azure Managed Grafana with a new data source and default dashboards to visualize your Prometheus data.
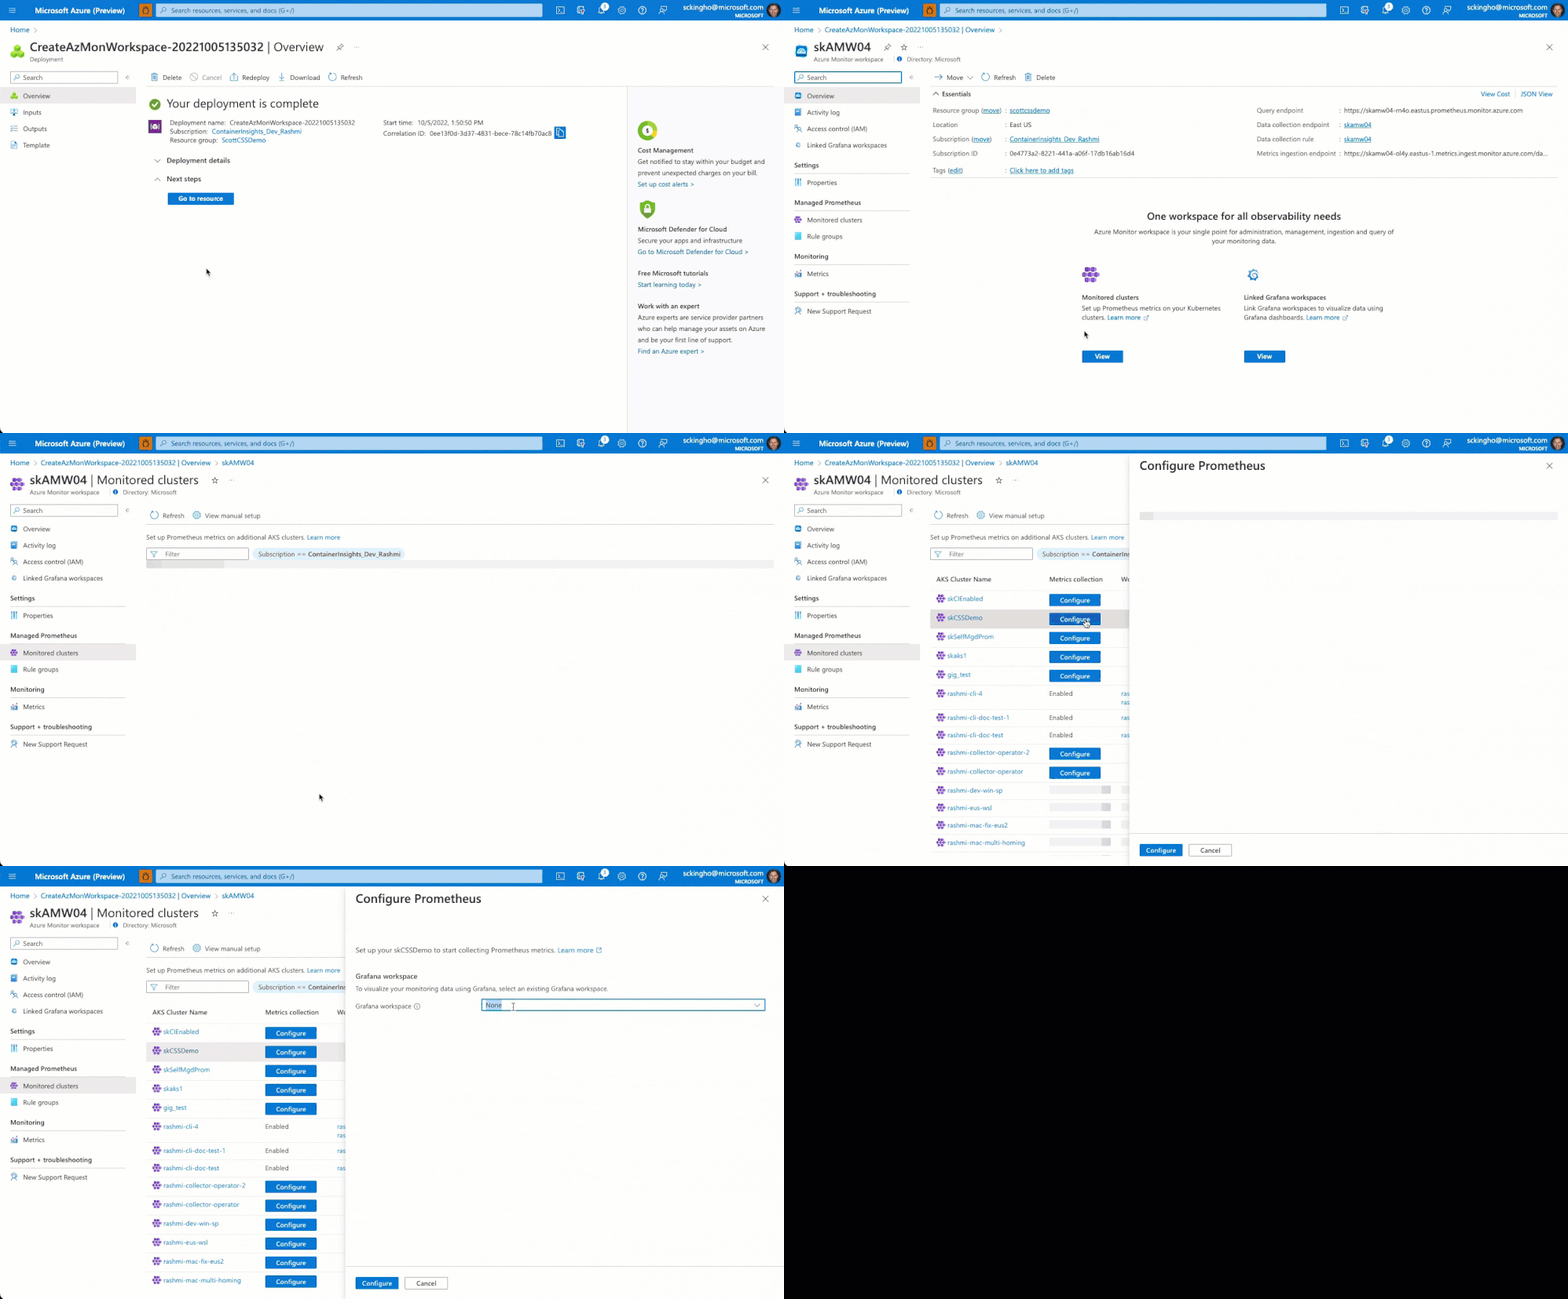 Configure your cluster and setup Azure Managed Grafana
With our Prometheus compatible interfaces you can easily reuse your existing recording and alert rules as well as your Grafana dashboards.
To further minimize changes, you can opt to get started by using our remote write collection method and continue running your self-managed Prometheus. You can then implement our managed collection when it makes sense and on your own time-line.
Integrated with other Azure services
For existing Container Insights customers you will see a new option to enable Managed Prometheus for your cluster. With just a few steps you can enable Managed Prometheus and get your cluster configured with managed data collection.
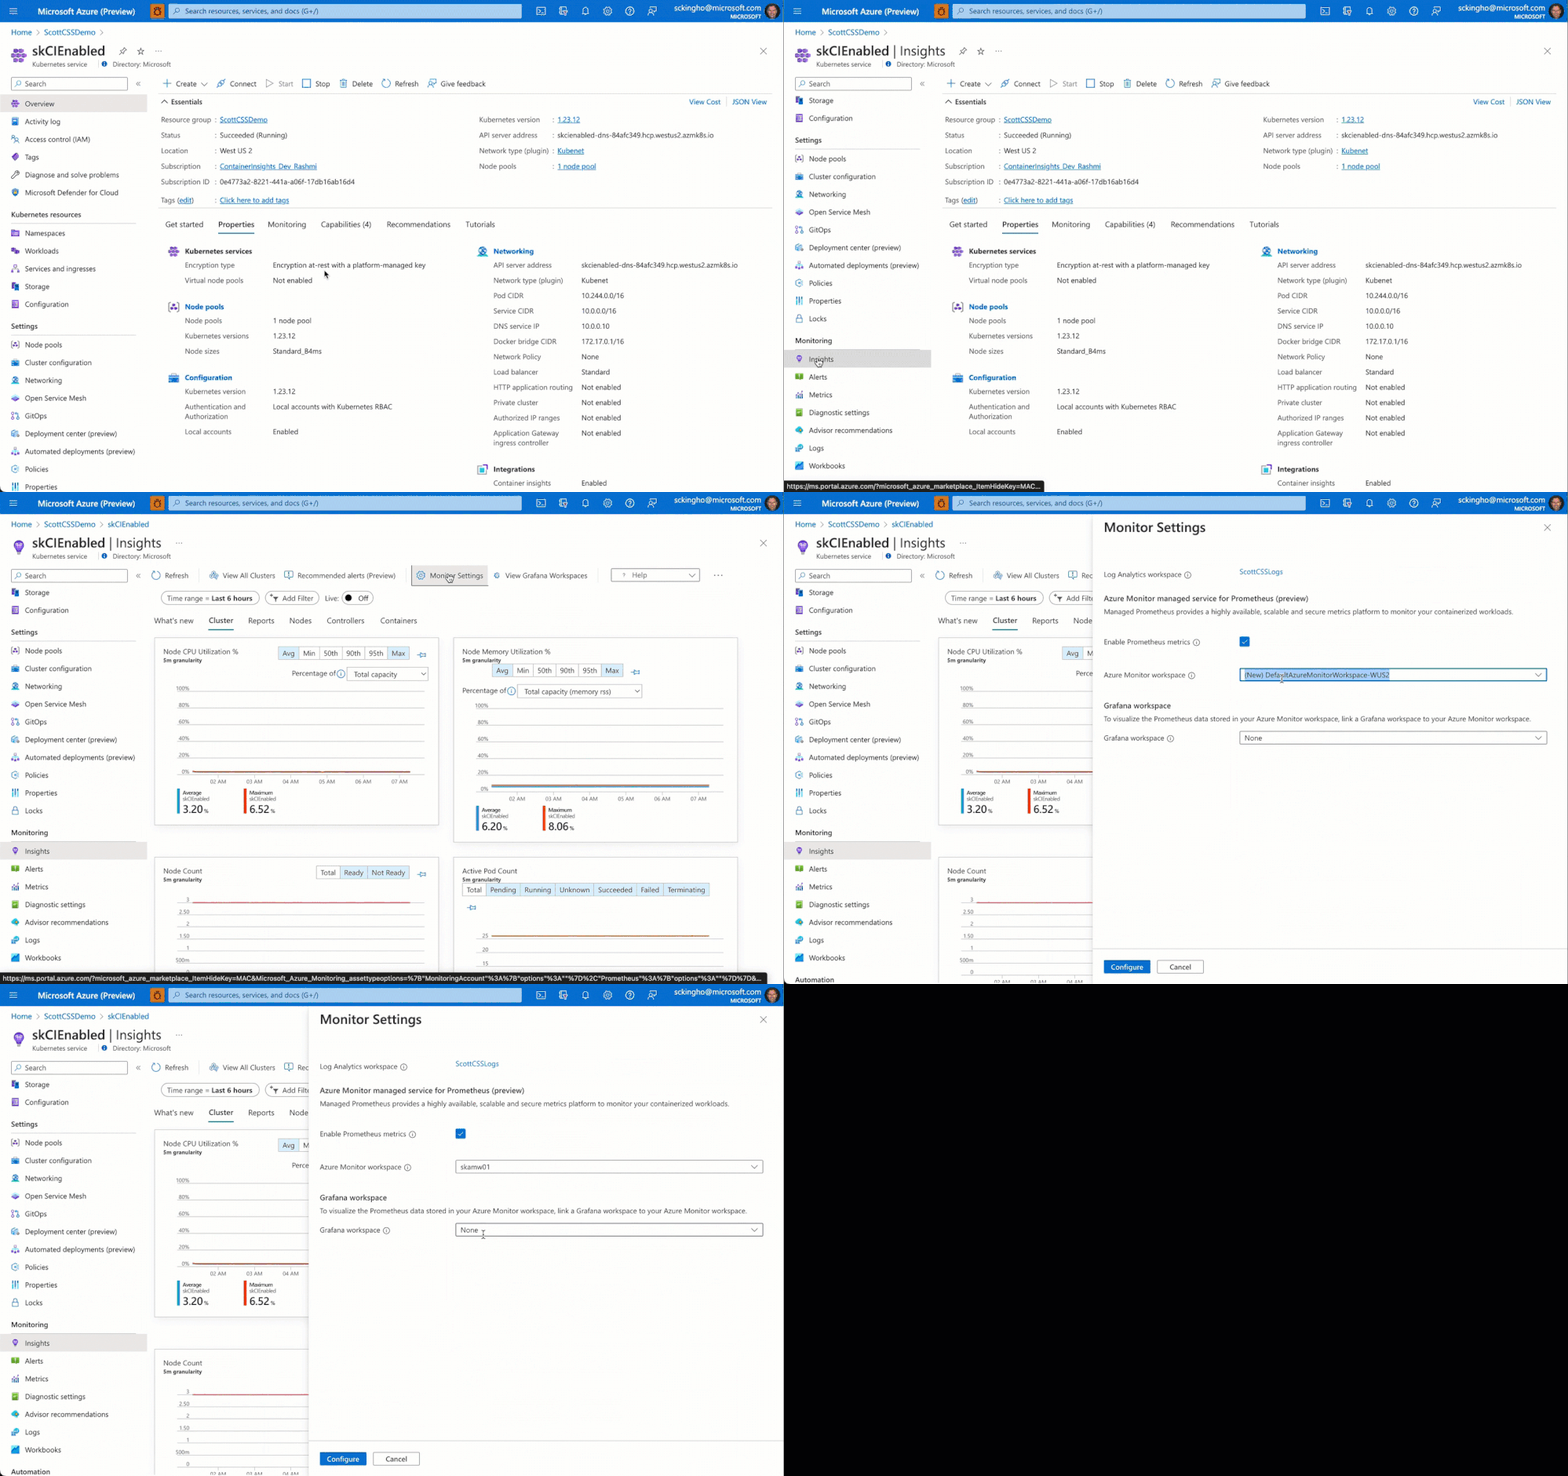 Enable Azure Monitor managed service for Prometheus from Azure Kubernetes Service and Container Insights
During the setup process you will have the option to add Managed Prometheus as a new data source to your Azure Managed Grafana workspace. We will also create a few default dashboards to get you started with visualizing your Prometheus data. Once setup, you can navigate into Azure Managed Grafana from both Managed Prometheus and Container Insights,
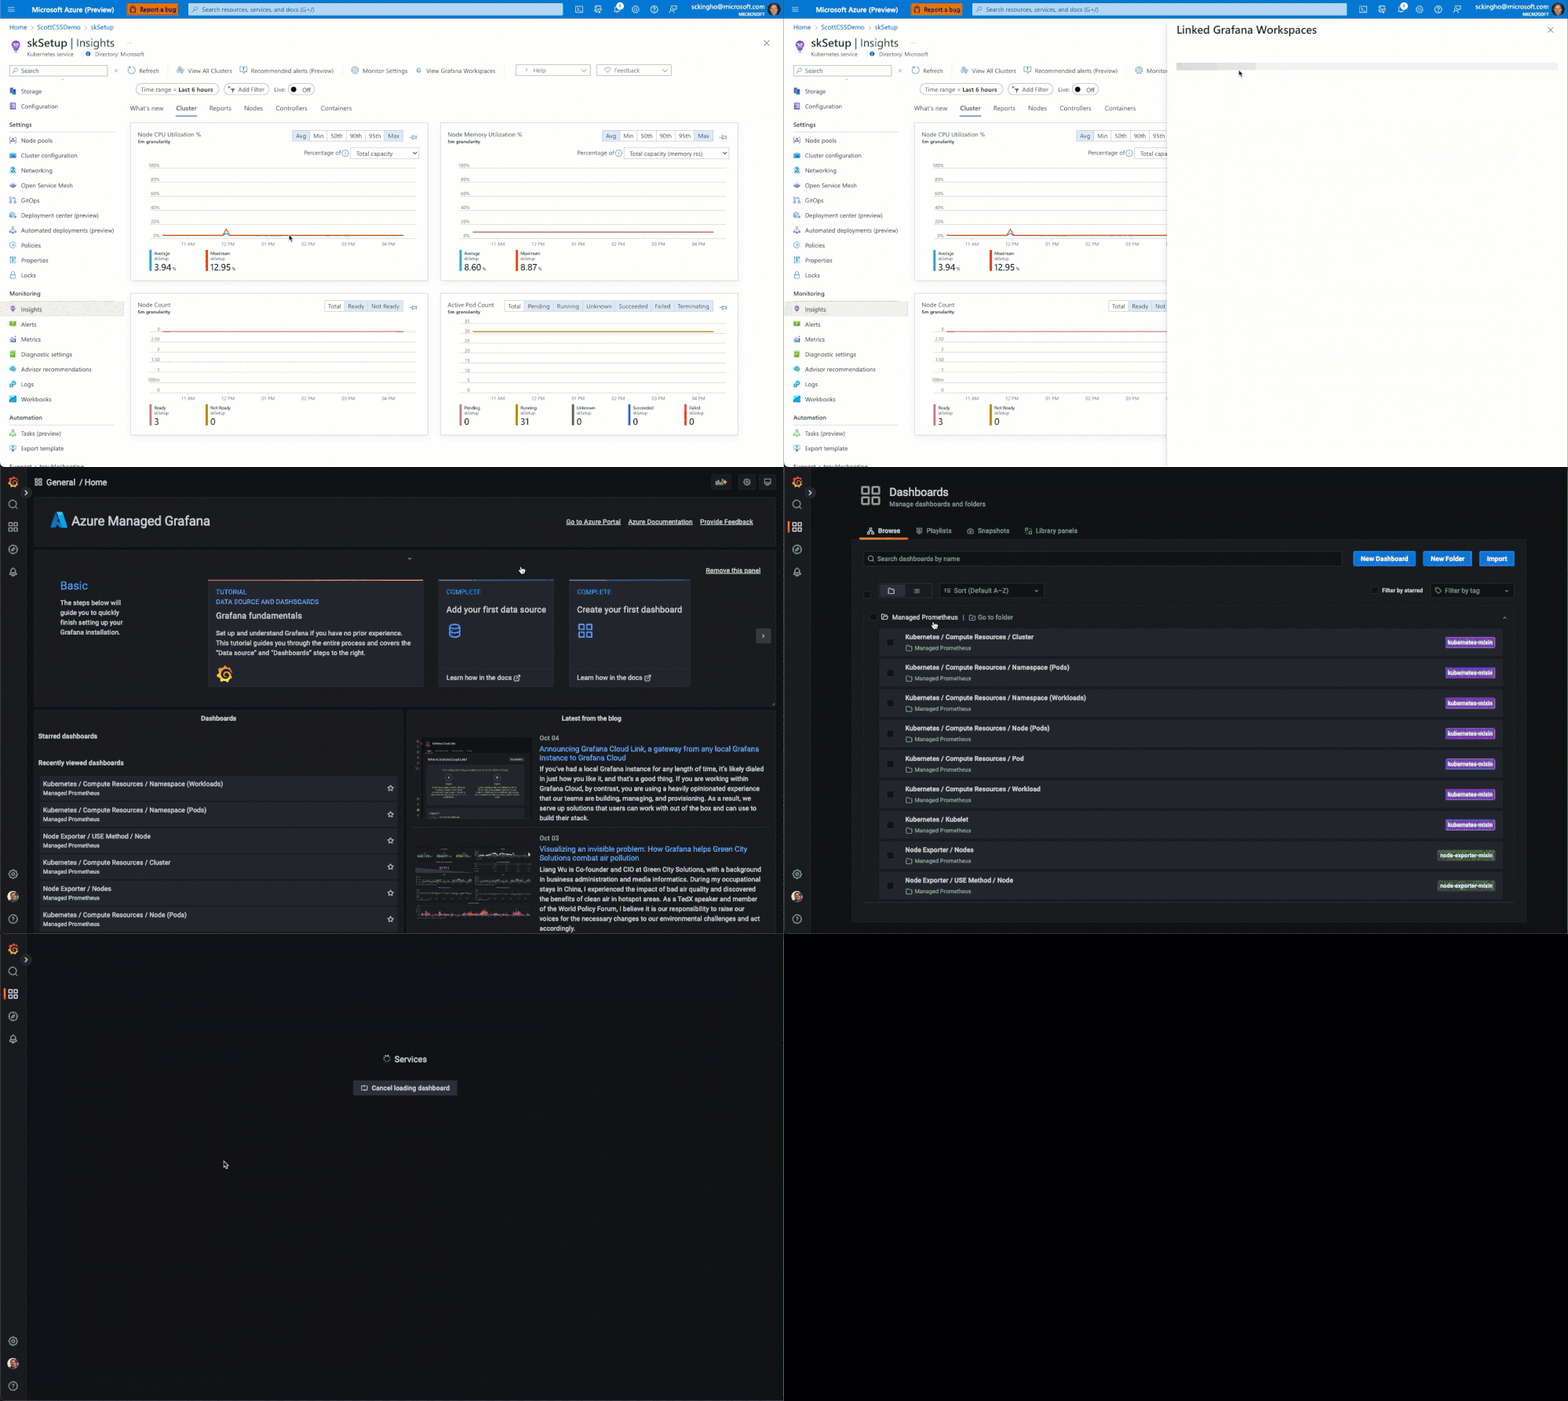 View your Prometheus data in Azure Managed Grafana
Later, once you have defined your Prometheus alert rules and have triggered alerts, you will have access to all of the action and notification capabilities from the Azure Monitor Alerts platform.
Get started with Managed Prometheus
Azure Monitor managed service for Prometheus will be available in Public Preview in 11 regions, including: Central US, East US, East US 2, South Central US, West US, West US 2, North Europe, West Europe, UK South, Central India, and Southeast Asia.
We have started rolling out this new offering today and it will arrive in all of the supported Public Preview regions within a week. To get started, you can either search for "Managed Prometheus" in the Azure Portal or refer to our documentation. Our pricing information is available for your to review, but billing is not enabled. We will enable billing for Managed Prometheus prior to moving the offering into GA.
