This post has been republished via RSS; it originally appeared at: Azure Database Support Blog articles.
Symptom:
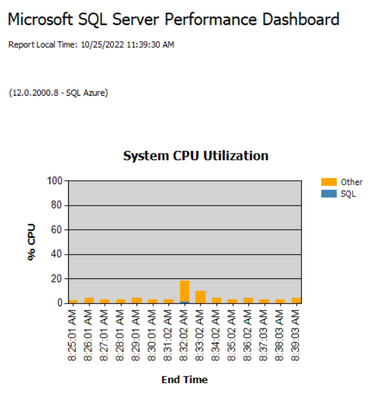
When using Performance Dashboard on Azure SQL Managed Instance you may find that percent of CPU usage is different (lower) than reported by Azure Portal for your Managed Instance.
You may wonder which is the correct value.
Resolution:
When Managed Instance is provisioned you set the number of vCores you desire to have.
Assume you choose X vCores you end up with machine that has Y>=X.
You will only be charged for X vCores, and the system will restrict your Managed Instance to use only X vCores out of Y
This is done to make sure your Instance will always have enouph resources and to avoid distruptions.
Now, here is the reason, Azure Portal is aware that you have selected only X vCores so you will be able to see the correct used percent of your Managed Instance.
SSMS Performance Dashboard is using SQL internal DMVs to get the needed information, while the SQL Engine is aware of the Y vCores the VM has. This is why percentage may not be presented correctly.
For Instance, assume you have created 8vCores Managed Instance and your instance placed on VM with 16 vCores.
When you consume 100% CPU, Azure Portal will show 100% used, but SSMS Performance Dashboard will show 50% only.
Figure - CPU Utilization - Preformance Dashboard.

