This post has been republished via RSS; it originally appeared at: Microsoft Tech Community - Latest Blogs - .
Introduction:
Data migration is the process of transferring data from one source to another. It can be a complex and time-consuming task, especially when dealing with large amounts of data. One of the complexity of data migration is data volume and velocity. Handling large amounts of data can be a challenging task, as it may require specialized hardware, software, and network infrastructure to transfer the data in a timely manner. Time and cost are also important factors to consider when migrating data.
Azure Data Explorer (ADX) is a fast and highly scalable data exploration service that enables real-time analysis on big data. ADX provides a simple and efficient way to ingest, store, and analyze large amounts of data.
This article is an extension to an existing article to migrate data from Elastic Search to Azure Data Explorer (ADX) using Logstash pipeline as a step-step-step guide. In this article, we will explore the process involved in migrating data from one source (ELK) to another (ADX) and discuss some of the best practices and tools available to make the process as smooth as possible.
Using Logstash for data migration from Elasticsearch to Azure Data Explorer (ADX) was a smooth and efficient process. With the help of ADX output plugin & Logstash, I was able to migrate approximately 30TBs of data in a timely manner. The configuration was straightforward, and the data transfer with ADX output plugin was quick and reliable. Overall, the experience of using ADX output plugin with Logstash for data migration was positive and I would definitely use it again for similar projects in the future.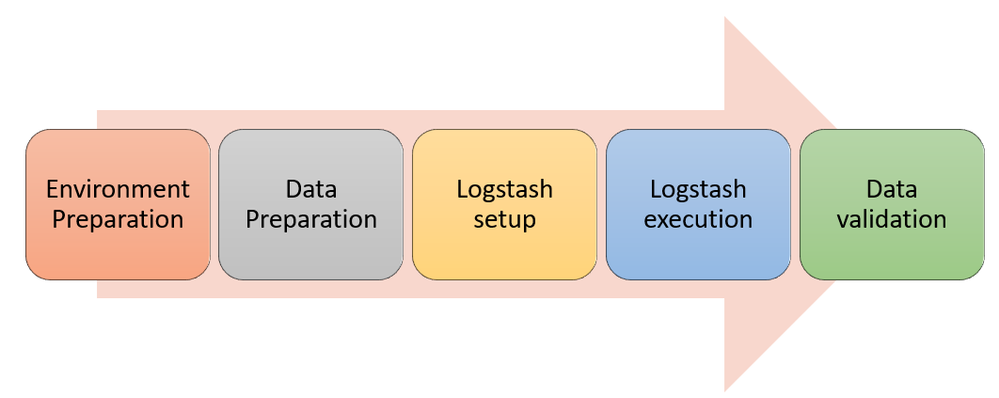
Environment preparation:
Properly preparing the target environment before migrating large amounts of data is crucial for ensuring a smooth and successful transition. This includes performing thorough testing and validation of the new system to ensure compatibility and scalability, as well as taking steps to minimize any potential disruptions or downtime during the migration process.
Additionally, it's important to have a well-defined rollback plan in case of any unforeseen issues. It's also important to back up all the data and check the integrity of the backup data before the migration process.
In this article, we will go over the steps to set up both ELK (Elasticsearch, Logstash, and Kibana) cluster and Azure Data Explorer (ADX) clusters and show you how to connect and migrate the data.
Setting up Elasticsearch
The first step in setting up an ELK cluster is to set up Elasticsearch. To set up Elasticsearch, you will need to follow these steps:
- Download and install Elasticsearch on your machine directly from the Elastic portal. If you need a specific version of Elastic search, download from previous releases page
- Extract the contents of the downloaded zip file and open "command prompt" in windows and navigate to the bin folder and and type "elasticsearch".
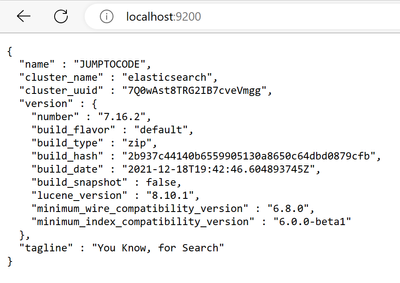
- Great news! Now you have the Elasticsearch running on your machine. Verify that it is running by visiting
http://localhost:9200in your browser. - For more configuration settings of Elasticsearch, you can look up
elasticsearch.ymlfile in the downloaded folder. This file contains various settings that you can adjust to customize your Elasticsearch cluster.
Setting up Logstash
The next step in setting up an ELK cluster is to set up Logstash. Logstash is a powerful data processing pipeline that can collect, process, and forward data to Elasticsearch. To set up Logstash, you will need to follow these steps:
- Download Logstash on your machine from the elastic portal
- Open "command prompt" and navigate to the bin folder of the downloaded content. Type "logstash"
- Logstash is now running and verify that it is running by visiting
http://localhost:9600in your browser. - Configure Logstash by editing the
logstash.conffile. This file contains various settings that you can adjust to customize your Logstash pipeline.
Setting up Kibana (Optional)
The final step in setting up an ELK cluster is to set up Kibana. Kibana setup is an optional setup for this migration process. To set up Kibana, you will need to follow these steps:
- Download and install Kibana on your machine from the elastic portal
- Start Kibana and verify that it is running by visiting
http://localhost:5601in your browser. - Configure Kibana by editing the
kibana.ymlfile. This file contains various settings that you can adjust to customize your Kibana installation.
Kibana is a powerful data visualization tool that can be used to explore and analyze data stored in Elasticsearch. Once it is setup, you can query Elastic search data through Kibana using KQL (Kibana Query Language). Below is a sample interface of Kibana and the KQL showing the cluster health
Setting up Azure Data Explorer
The next step is to create an Azure Data Explorer (ADX) cluster, database, tables and related schema required for migration. To set up ADX, you will need to follow these steps:
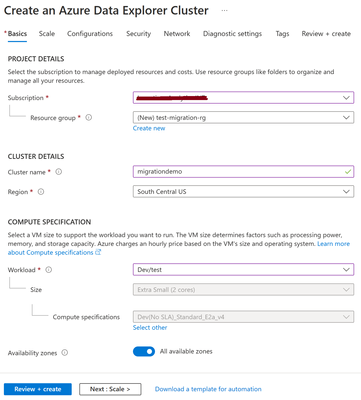
- Navigate to Azure Portal (portal.azure.com) and Create an Azure Data Explorer cluster with your desired configuration. Alternatively, you can refer to this article in creating a new ADX cluster.
- Once your cluster is created, you will be able to connect to it using the ADX Web UI.
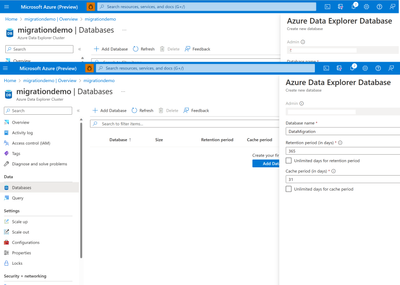
- The next step is to create a database in the newly created ADX cluster. Click on "Add Database" in the Cluster and give it a name - "DataMigration"
Setting up AAD AppId
The next step is to create an AAD App id that and add to newly created ADX database as an "Ingestor" role. By setting this up, this app id can be used in the Logstash pipeline for migration purposes. To setup the AppId and delegated permissions in ADX, refer to this official article.
Great news! Now you have setup successfully both ELK and ADX clusters. With the environment fully set up, we are now ready to begin with the next migration steps.
Data Preparation:
The next step in the process is to prepare and formatting the data properly, as well as setting up the required schema in ADX, is crucial for a successful migration process.
Setting up ADX schema
To properly ingest and structure the data for querying and analysis in ADX, it is essential to create necessary schema in ADX for migration process. This process involves defining the structure of the table and the data types for each field, as well as creating a mapping to specify how the data will be ingested and indexed.
"This step is crucial for the data migration from ELK to ADX, as it ensures that the data is properly structured and can be easily queried and analyzed once it is in ADX. Without a proper schema and mapping, the data migration may not work as expected and the data may not be properly indexed and queried in ADX."
Using ADX Script:
Creating a new table in ADX using a specified schema can aid in setting up sample data for migration from ELK. The below schema creates a sample table that can hold data about Vehicle information.
To create the target ADX table for migration, follow the below steps.
- Navigate to newly created Azure data explorer cluster in the Azure portal
Schema creation in ADX
- Execute the schema to create the Vehicle table and ingestion mapping targeted on the Vehicle table.
// creates a new table .create tables Vehicle(Manufacturer:string,Model:string,ReleaseYear:int, ReleaseDate:datetime) // creates a ingestion mapping for the table .create table Vehicle ingestion json mapping 'VechicleMapping' '[{"column":"Manufacturer","path":"$.manufacturer"},{"column":"Model","path":"$.model"} ,{"column":"ReleaseYear","path":"$.releaseYear"}, {"column":"ReleaseDate","path":"$.releaseDate"}]' - The ingestion mapping is critical, it establishes the mapping of the target column to the source column in ELK. For simplicity purpose, both the source and target columns are named with the same name.
Using ADX One Click Ingestion wizard (on the ADX Web UI):
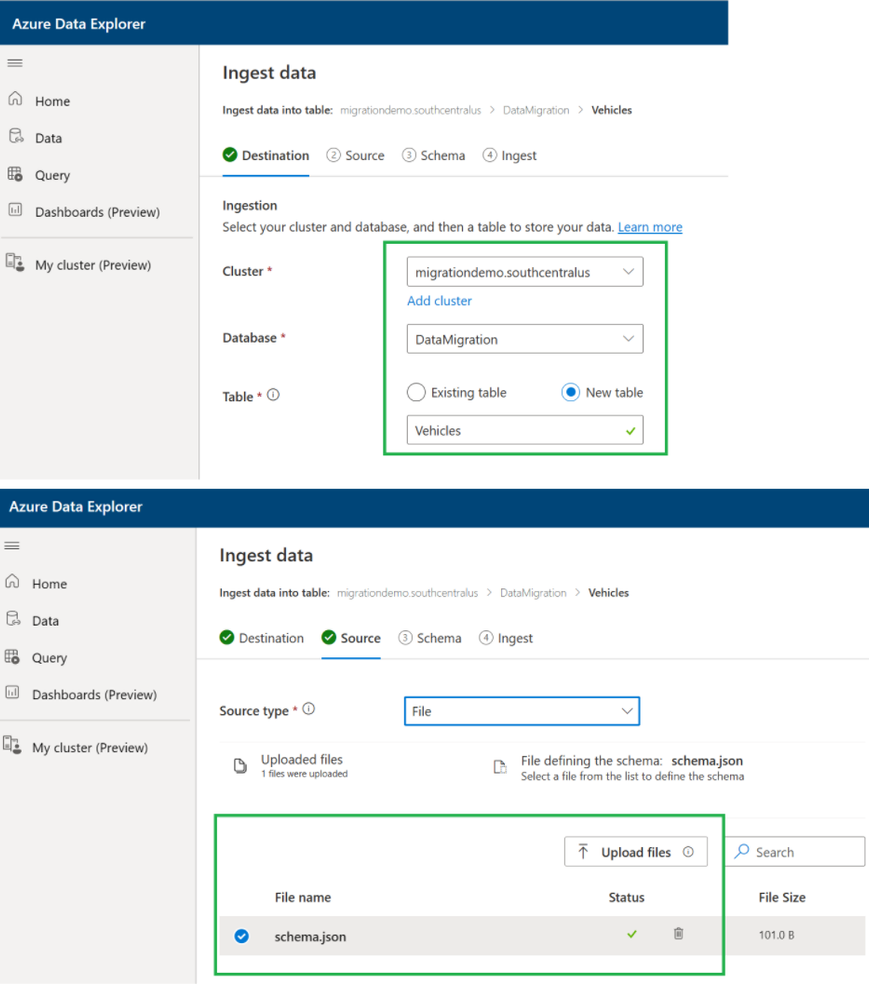
Another way to create the schema and ingestion mapping automatically in ADX is through the ADX One Click Ingestion feature, which is a scalable and cost-effective way to ingest data.
- Navigate to ADX cluster in the Azure portal.
- In the cluster overview page, click on "Ingest" and it opens the ADX One Click Ingestion feature in a new window.
- Construct a JSON file as like below with your desired properties. If you already have data with the schema, then the ADX One Click Ingestion feature automatically ingests the data into the table.
// Construct your schema properties in JSON format like below
{
	"Manufacturer":"string",
	"Model":"string",
	"ReleaseYear":"int",
	"ReleaseDate":"datetime"
}
- Upload the created JSON file as schema file and continue the steps shown in the ADX One Click Ingestion feature wizard.
This process automatically creates an ingestion mapping based on the provided schema.
Setting up data in ELK:
Now that the target schema in ADX is ready, let's start setting up some data in Elastic search cluster that will be used for the data migration.
Note: If you already have data in your cluster, skip this step and make sure you created corresponding table and ingestion mapping schema in ADX based on your schema.
There are several ways to create sample data in an Elasticsearch cluster, but one common/easy method is to use the Index API to index JSON documents.
- Run your local ES cluster as mentioned in the environment setup section and navigate to http://localhost:9200 to ensure the cluster is running.
- You can execute below commands using a http clients like Postman, fiddler, etc.,
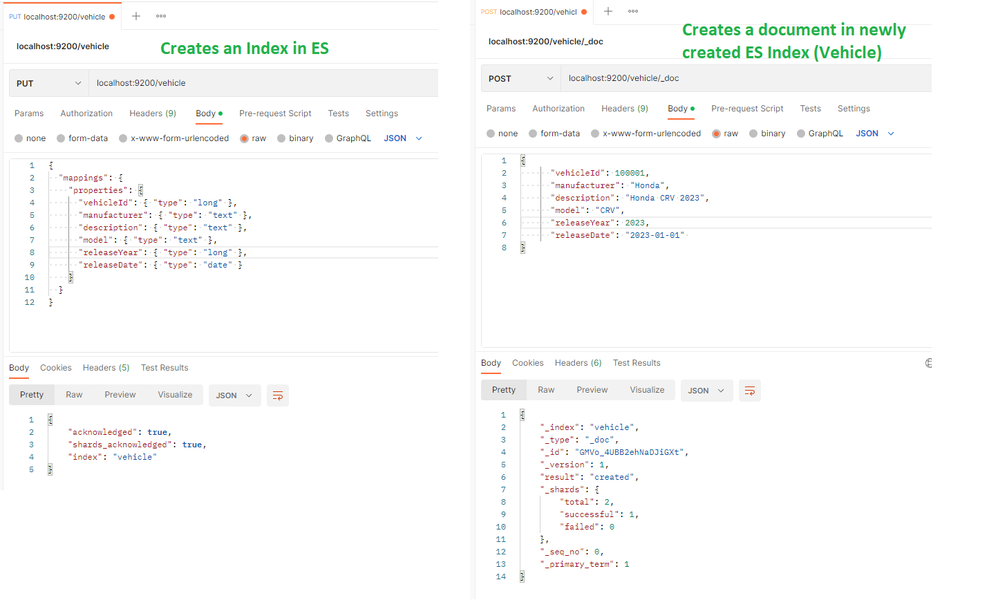
- By executing the commands, first it will create an Index named with "Vehicle" in the elastic search and then creates some sample documents for newly created index. This way, try creating few more sample documents for the Index for data migration. Alternatively, you can ingest multiple documents using Elastic search _bulk API
PUT vehicle
{
  "mappings": {
    "properties": {
      "vehicleId": { "type": "long" },
      "manufacturer": { "type": "text" },
      "description": { "type": "text" },
      "model": { "type": "text" },
      "releaseYear": { "type": "long" },
      "releaseDate": { "type": "date" }
    }
  }
}
POST vehicle/_doc
{
      "vehicleId": 100001,
      "manufacturer": "Honda",
      "description": "Honda CRV 2023",
      "model": "CRV",
      "releaseYear": 2023,
      "releaseDate": "2023-01-01"
}
Sample of creating the Index and document using postman:
Logstash Setup
It is crucial to properly set up an Logstash pipeline when migrating data to ADX, as it ensures that the data is properly formatted and transferred to the target system. Setting up a Logstash pipeline for data migration to ADX involves the following steps:
-
Install the ADX output plugin: The ADX output plugin for Logstash is not included by default, so you will need to install it by running the command.
logstash-plugin install logstash-output-kusto - Logstash pipeline:
A Logstash configuration file, often referred to as a "logstash.conf" file, is a text file that defines the pipeline for Logstash to process data. The file is written in the Logstash Configuration Language (LCF) and contains three main sections: input, filter, and output.
a. The input section is where you define the source of your data, such as a file or a database. You can also specify options such as codecs, which are used to decode the data, and plugins, which can be used to enhance the input functionality.
b. The filter section is where you can perform various operations on your data, such as parsing, transforming, and enriching it. You can use built-in filters or create custom filters using the filter DSL (domain-specific language).
c. The output section is where you define the destination for your processed data, such as a file, a database, or a search engine.
- Logstash Pipeline creation:
- Below is the pipeline configuration for migrating the data from ELK to ADX. The input section specifies the Logstash to read the data from Elastic search cluster. Note: For a local host environment, you may not need ssl & ca_file properties as these might be needed in Production environments as they are more secured for access.
- The "query" property in the pipeline is to fetch specific data from the Elastic search Index, instead of reading the whole Index data. Note: This is optional in case if you need to migrate the whole Index.
- During the pipeline execution, Logstash reads the data from the input source and writes to local store "/tmp/region1/%{+YYYY-MM-dd}-%{[@metadata][timebucket]}.txt".
- As part of this writing process, the ruby filter prevents duplicate data getting ingested into ADX, by setting a unique timestamp of file with elastic search data every 10secs. This is a good practice that chunks the files with a unique timestamp ensures the data is properly processed for migration.
- The output plugin section is to configure all the target source properties. The ingestion_url can be fetched from the Azure portal as part of the ADX cluster properties. The database, table and json_mapping are the properties where the data can be mapped and migrate to ADX table. The output plugin requires app_id & app_secret which validates the authentication to the ADX cluster for migration.
- For more info on ADX output plugin, refer to this github
-
Below is the Logstash pipeline that ingests data from single instance of elastic search to one ADX cluster.
input {
  elasticsearch {
    hosts => "http://localhost:9200"
    index => "vehicle"
    query => '{ "query": { "range" : { "releaseDate": { "gte": "2019-01-01", "lte": "2023-12-31" }}}}'
    user => "elastic search username"
    password => "elastic search password"
    ssl => true // If SSL is enabled
    ca_file => "Pass the cert file if any" // If any cert is used for authentication
  }
}

filter
{
  ruby
  {
    code => "event.set('[@metadata][timebucket]', Time.now().to_i/10)"
  }
}

output {
  kusto {
    path => "/tmp/region1/%{+YYYY-MM-dd}-%{[@metadata][timebucket]}.txt"
    ingest_url => "https://ingest-<<name of the cluster>>.region.kusto.windows.net"
    app_id => "aad app id"
    app_key => "app secret here"
    app_tenant => "app id tenant"
    database => "dataMigration"
    table => "Vehicle"
    json_mapping => "vehicleMapping"
  }
}
Read data from more than one Elastic search clusters (OR) read multiple indices?
Have you ever wondered about the possibility of reading data from multiple Elasticsearch clusters? Well, no problem at all!
Using Logstash pipeline, it is easy to read from multiple elastic search clusters or even multiple data sources like a cluster & file etc., Alternatively, you can read data from the same cluster, with multiple indices at the same time and ingest to the same table. Below is an example of Logstash pipeline that reads data from multiple Elastic search clusters and ingest data to ADX using the output plugin.
input {
  elasticsearch {
    hosts => "Elasticsearch DNS:9200"
    index => "Index 1"
    user => "elastic search username"
    password => "elastic search password"
    ssl => true // If SSL is enabled
    ca_file => "Pass the cert file if any" // If any cert is used for authentication
  }

  elasticsearch {
    hosts => "Elasticsearch cluster 2 DNS:9200"
    index => "Index 2"
    user => "elastic search username"
    password => "elastic search password"
    ssl => true // If SSL is enabled
    ca_file => "Pass the cert file if any" // If any cert is used for authentication
  }
}

filter
{
  ruby
  {
    code => "event.set('[@metadata][timebucket]', Time.now().to_i/10)"
  }
}

output {
  kusto {
    path => "/tmp/region1/%{+YYYY-MM-dd}-%{[@metadata][timebucket]}.txt"
    ingest_url => "https://ingest-migrationdemo.region.kusto.windows.net"
    app_id => "aad app id"
    app_key => "app secret here"
    app_tenant => "app id tenant"
    database => "ADX database name"
    table => "ADX table name"
    json_mapping => "ADX json ingestion mapping name"
  }
}
Using [tags] in Logstash
When it comes to handling large amounts of data, having multiple Elasticsearch indices can pose a challenge in terms of routing the data to different Azure Data Explorer (ADX) cluster tables. This is where the Logstash pipeline comes into play. By using the Logstash pipeline, you can easily route data from multiple Elasticsearch indices to different ADX cluster tables. The key to this is the use of [tags].
A tag is a label that you assign to a data set within the Logstash pipeline. By using tags, you can categorize data sets and route them to specific outputs. In this case, each Elasticsearch index can be tagged and routed to a specific ADX cluster table.
-
Use the tag option in the Elasticsearch input plugin to assign a unique tag to each Elasticsearch index.
-
Configure the ADX output plugin and set the table option to the specific ADX cluster table that you want to route the data to.
-
Use the conditional statement in the Logstash pipeline to route data with specific tags to the corresponding ADX cluster tables.
Below is a sample of Logstash pipeline using [tags] and routing the data to two different tables in ADX cluster.
input {
  elasticsearch {
    hosts => "Elasticsearch DNS:9200"
    index => "Index 1"
    user => "elastic search username"
    password => "elastic search password"
	tags  => ["Index1"]
    ssl => true // If SSL is enabled
    ca_file => "Pass the cert file if any" // If any cert is used for authentication
  }
  elasticsearch {
    hosts => "Elasticsearch DNS:9200"
    index => "Index 2"
    user => "elastic search username"
    password => "elastic search password"
	tags  => ["Index2"]
    ssl => true // If SSL is enabled
    ca_file => "Pass the cert file if any" // If any cert is used for authentication
  }
filter
{
  ruby
  {
    code => "event.set('[@metadata][timebucket]', Time.now().to_i/10)"
  }
}

output {
    if "Index1" in [tags]{
	 kusto {
             path => "/tmp/region1/%{+YYYY-MM-dd}-%{[@metadata][timebucket]}.txt"
             ingest_url => "https://ingest-name of the cluster.region.kusto.windows.net"
             app_id => "aad app id"
             app_key => "app secret here"
             app_tenant => "app id tenant"
             database => "ADX Database"
             table => "Table1"
            json_mapping => "json mpapping name"
              }
	}
    else if "Index2" in [tags] {
	 kusto {
             path => "/tmp/region1/%{+YYYY-MM-dd}-%{[@metadata][timebucket]}.txt"
             ingest_url => "https://ingest-name of the cluster.region.kusto.windows.net"
             app_id => "aad app id"
             app_key => "app secret here"
             app_tenant => "app id tenant"
             database => "ADX Database"
             table => "Table2"
             json_mapping => "json mpapping name"
            }
	}
}
In conclusion, using Logstash to route data from multiple Elasticsearch indices to different ADX cluster tables is an efficient and effective way to manage large amounts of data. By using the [tags] feature, you can categorize data sets and route them to specific outputs, making it easier to analyze and make decisions.
Logstash Execution:
Before running the pipeline, it's a good practice to test it by running a small data sample through the pipeline and ensure that the output is as expected. It's important to monitor the pipeline during the data migration process to ensure that it is running smoothly and to address any issues that may arise.
Now that we've setup the environment, data preparation and Logstash pipeline configuration, run the created configuration and validate if the data migration is successful. To execute the pipeline, follow the below steps:
- Navigate to the Logstash bin folder
// Executes the pipeline bin/logstash -f logstash.conf- Logstash can also execute multiple configuration files by having more than one .conf files.
Data Validation:
Data validation is an important step in the process of migrating data from Elasticsearch to ADX (Azure Data Explorer) to ensure that the data has been migrated correctly and is accurate and complete.
The process of data validation for a specific index can be broken down into the following steps:
-
Schema validation: Before migrating the data, it's important to verify that the data structure in the source index (Elastic Search) matches the data structure in the destination index (ADX). This includes verifying that all the fields, data types, and mapping are the same.
-
Data comparison: After migrating the data, compare the data in the new ADX index to the original data in the ELK index. This can be done using a tool like Kibana in ELK stack and query directly in ADX for migrated data., which allows you to query and visualize the data in both indexes.
-
Query execution: Once the data has been migrated, run a series of queries against the ADX index to ensure that the data is accurate and complete. This includes running queries that test the relationships between different fields, as well as queries that test the data's integrity.
-
Check for missing data: Compare the data in the ADX index with the data in the ELK index to check for missing data, duplicate data or any other data inconsistencies.
-
Validate the performance: Test the performance of the ADX index and compare it with the performance of the ELK index. This can include running queries and visualizing the data to test the response times and ensure that the ADX cluster is optimized for performance.
It is important to keep in mind that the data validation process should be repeated after any changes made to the data or the ADX cluster to ensure that the data is still accurate and complete.
Below are some of the data validation queries to perform in both Elastic search and ADX for data validation.
// Gets the total record count of the index
GET vehicle/_count

// Gets the total record count of the index based on a datetime query
GET vehicle/_count
{
  "query": {
    "range" : {
      "releaseDate": { "gte": "2021-01-01", "lte": "2021-12-31" }
              }
           }
}

// Gets the count of all vehicles that has manufacturer as "Honda".
GET vehicle/_count
{
  "query": {
    "bool" : {
      "must" : {
        "term" : { "manufacturer" : "Honda" }
      }
    }
  }
}

// Get the record count where a specific property doesn't exists in the document. This is helpful especially when some document do not have NULL properties.
GET vehicle/_count
{
  "query": {
    "bool": {
      "must_not": {
        "exists": {
          "field": "description"
        }
      }
    }
  }
}
Below are some of the validation queries to use in ADX for data validation
// Gets the total record count in the table
Vehicle
| count

// Gets the total record count where a given property is NOT empty/null
Vehicle
| where isnotempty(Manufacturer)

// Gets the total record count where a given property is empty/null
Vehicle
| where isempty(Manufacturer)

// Gets the total record count by a property value
Vehicle
| where Manufacturer == "Honda"
| count
Additionally, it is good to have a rollback plan in place in case any issues arise during the migration and to keep track of any issues found and how they were resolved.
Migration in Production environment:
After successfully testing data migration from Elasticsearch to Azure Data Explorer (ADX) in a local environment, the next steps would be setting up the configuration and pipeline in the production environment.
The production environment is typically different from the local environment in terms of data volume, complexity, and network infrastructure. It's important to evaluate the production environment and determine if any changes need to be made to the migration process to ensure it runs smoothly.
With the aim of efficiently transferring a large amount of data, leveraging the right tools and techniques is key. In this scenario, the use of Logstash and the ADX Output Plugin, along with 5 Linux virtual machines, allowed for a seamless migration of 30TB and over 30 billion records.
To carry out the migration, Logstash and the ADX Output Plugin were installed on 5 Linux virtual machines. The Logstash pipeline was then configured to ingest the data from its source and send it to multiple ADX clusters. With this approach, the massive amount of data was transferred smoothly and with ease.
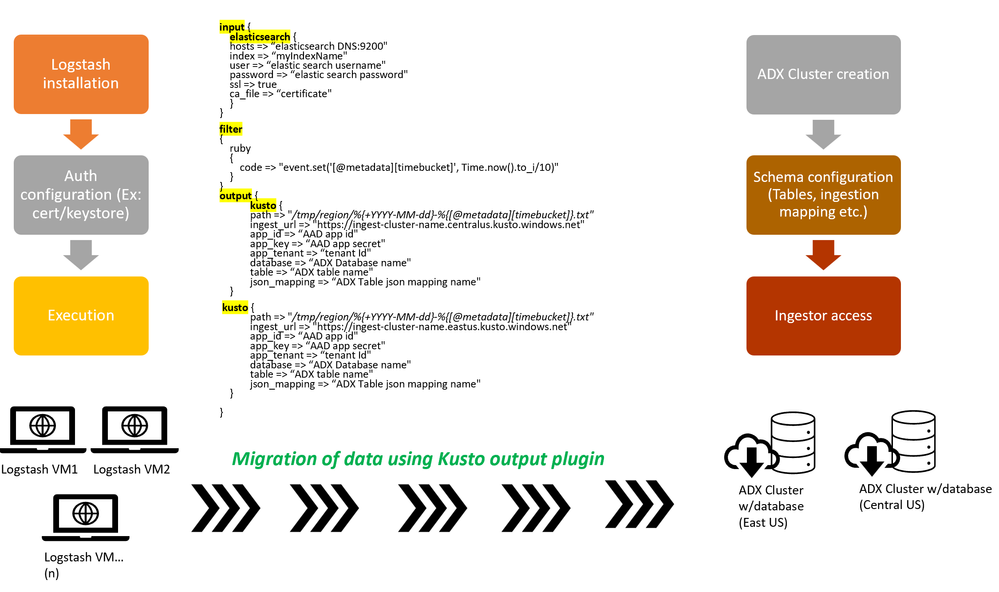
Below is the overview of the migration process that involved multiple Logstash machines for data migration and ingest to multiple ADX clusters.
The plugin has two output Kusto plugins pointed to different regions. This way, you can ingest data into multiple regions using Logstash. Similarly, you could also have multiple input plugins that could read data from different sources and ingest to different sources.
Troubleshooting?
Data migration from Elasticsearch to Azure Data Explorer (ADX) can encounter various issues that require troubleshooting. Here are a few common issues and solutions:
- Performance degradation: Migration can result in decreased query performance if the data is not optimized for ADX. This can be resolved by ensuring the data is partitioned and clustered in an optimal manner.
-
Mapping errors: Incorrect mapping can result in data not being properly indexed in ADX. Verify the mapping to ensure it is correct and use the mapping API in ADX to update it if needed.
- Ensure the ingestion mapping has the right set of properties defined.
- The mapping properties are case sensitive, it is better to validate if there are casing issues.
- Check the right mapping Name and type of mapping is used. As ADX supports multiple mapping such as Json, csv etc., ensure the ingestion mapping was properly created.
// Shows all the mappings created in the database and the targeted table.
.show ingestion mappings
-
Data ingestion errors: Data may fail to be ingested into ADX due to incorrect ingestion settings or security issues. Ensure the ingestion settings are correct, and the firewall rules are set up to allow data ingestion.
// Shows any ingestion failures .show ingestion failures - Logstash errors: In case of any failures, look up if there any errors during the Logstash execution. In production environment, the logs are usually present under /mnt folder
// Ideal location for logstash logs /mnt/logstash/logs/logstash-plain.log- Below are some of the Logstash commands that can be handy to start, stop or restart the Logstash service in a Linux environment.
// check the status of logstash service
sudo service logstash status

// stop the logstash service
sudo systemctl stop logstash

// start the logstash service
sudo systemctl start logstash
Important: When Logstash fails during data migration, it can have a significant impact on the migration process and result in data loss or corruption. Logstash service do not have any automatic checkpoint mechanism on the data migration. In case of any failure during the data migration, Logstash starts the migration from the beginning, and you end up having duplicates at the target source.
By addressing these common issues, you can ensure a smooth data migration from Elasticsearch to ADX.
In conclusion, migrating data from Elasticsearch to Azure Data Explorer can greatly enhance the management and analysis of large amounts of data. With the benefits of ADX's powerful data exploration capabilities, combined with the ability to easily transfer data using tools such as Logstash, organizations can streamline their data management processes and gain valuable insights to drive informed decisions. The migration from Elasticsearch to ADX represents a step forward in modern data management and analysis.


