This post has been republished via RSS; it originally appeared at: Microsoft Tech Community - Latest Blogs - .
This is the second post in a 3-part blog series on Power BI with Azure Databricks SQL authored by Andrey Mirskiy and Diego Fanesi. Read Part 1: Power Up your BI with Microsoft Power BI and Azure Databricks Lakehouse: part 1 - Essentials
This article will cover Performance Optimization for Microsoft Power BI when querying the Databricks Lakehouse! While our previous article addressed how to connect and correctly configure your Power BI report to access Azure Databricks SQL Warehouse, here we will look at performance improvements techniques. We will cover recent feature releases that reduce the report loading time, and a few tunings you can apply to your dashboard.
We previously introduced an approach to BI dashboards on top of your Lakehouse with Power BI connected to the Azure Databricks SQL Warehouse. However, if you find that your queries are running quite fast on the Azure Databricks SQL side, but the dashboards are still taking a long time to load, or tables are taking a long time to be imported, the topics we will address in this article are likely to be relevant for you.
We will consider the same Import and Direct Query modes that were introduced previously and share some optimization techniques for each of the two approaches. Additionally, we will discuss Microsoft's Power BI query parallelization feature, which can help optimize the performance of large datasets with complex queries in Direct Query mode.
Additionally, we will discuss Power BI table partitioning, Cloud Fetch, Azure Databricks SQL Native Query support, and techniques for pushing DAX formulas down to the source - specifically, to Azure Databricks SQL, which sits in the right spot in the architecture to best optimize your query.
We hope these tips and techniques will prove to be effective in improving the performance of your Power BI dashboards on top of your Databricks Lakehouse. Stay tuned for part three of this series, where we will dive into Databricks query performance optimization to help you get the best performance from your Lakehouse!
Power BI and Azure Databricks SQL SKU
When discussing Power BI performance optimization topics, an introductory discussion about the Power BI SKU is necessary. As you might know, Power BI has multiple SKU, which leads to different features, different hardware characteristics for the Power BI service, and, ultimately, different performance. For instance, the Power BI Pro SKU does not parallelize queries, while the Power BI Premium SKUs have the capability of parallelizing queries.
Azure Databricks SQL Warehouse SKU also has an impact on the performance. On your Databricks SQL Warehouse configuration, you can choose between Classic, Pro and Serverless SKUs (it needs to be enabled, see link). Serverless, generally available since May 3rd 2023, is generally the most performant for BI use cases, regardless of the tool used to query the Lakehouse. Pro is also very performant, but it has considerably higher timings for upscaling and starting Azure Databricks SQL cluster. For this reason, you should consider upgrading your SQL Warehouse to Serverless SKU to assure the best performance for your BI workloads.
For the purpose of this blog post, we will assume you are already running on a Power BI Premium SKU and using either Azure Databricks SQL Serverless or Pro. Please note that not all optimizations we will use in this blog post are available on non-Premium SKUs of Power BI.
Import mode
With Import mode, we are essentially ingesting a whole table from our Lake House into Power BI in-memory dataset. This means Power BI is producing a query that usually returns a large number of records (ultimately all present in the table), including generally all or a large set of columns. Query result sets can vary from a few MBs for the smallest tables, to several GBs for the larger ones.
In this section, we are specifically looking at data transfer and ingestion of large data sets. We will start by talking about a new feature we are releasing that will significantly improve the data ingestion performance in Import mode.
Data Ingestion Performance - Connector Update
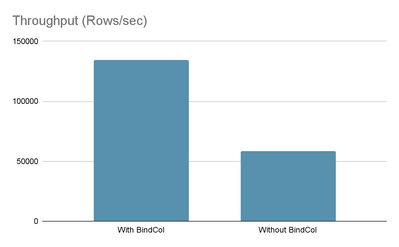
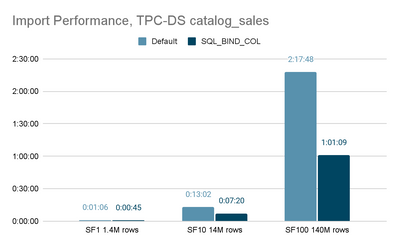
In the May 2023 release of the Azure Databricks Power BI connector, we are changing the ODBC API we internally use for the data ingestion by default. As a result of this change, the Power BI ingestion rate will increase by 2-3X, while some customers reported up to 5-6X data ingestion performance increase. However, the time difference also depends on the schema of the imported table and other factors.
Existing published reports will be automatically upgraded to the latest version of the connector as soon as it is released. Please make sure you upgrade your Power BI Desktop application as well.
Cloud Fetch and the Network Communication
Now let’s briefly talk about Databricks Cloud Fetch. Cloud Fetch is a feature that was released in 2021. It allows the JDBC/ODBC clients to receive large results sets through file download from cloud storage, increasing significantly the transfer rate. As per our benchmark, we observed a 12x improvement in the extract throughput when compared to the traditional approach. If you want to know more about this feature, there are several resources available on the web: blog post, summit talk and recording.
Cloud Fetch is already available in Power BI Service. Cloud Fetch support in Power BI Desktop was added in 2021. However, we strongly recommend you upgrade to the latest Power BI Desktop version as it includes the latest capabilities and performance features.
No verification is needed on Cloud Fetch: it is enabled by default on both Azure Databricks SQL and Power BI Service and if it does not work, queries will fail to retrieve result sets. However, being familiar with how this feature works will help us understand the network communication model.
What you can find below is a representation of the network communications in case of a query.
The first black arrow indicates that you are opening a report from your browser or from the Power BI Desktop application (assuming the dataset has been published). This will trigger a JDBC/ODBC connection between the Power BI Service and Azure Databricks Control plane, which you can see represented as a green arrow in the picture. This is necessary to make sure customers won’t need to open ports in their firewalls in order to establish a JDBC connection. However, any firewall/proxy standing between the Azure Databricks Clusters and the Azure Databricks Control Plane Services could potentially impact the performances and the latency of the queries. Especially if your firewall is particularly slow, it’s better to consider a private link or whitelisting the communication towards the Azure Databricks Control Plane, if possible.
If the result set is small, the green arrows represent the only communication channels that will be used. However, for results sets larger than 1MB, also the blue communication channel will be used, which relates to Cloud Fetch. In this case, depending on the security settings on your cloud provider, you might need to use a Power BI gateway, or you might have other protection layers in the middle of the Cloud Fetch communication.
Cloud storage services, such as Azure Data Lake Storage gen2, are designed to deliver exceptional performance to users. Comparatively, a single VM or server may not match the same level of performance as cloud storage. Thus, it is important to evaluate the data ingestion speed of Power BI Service and the speed of middle layers to achieve optimal performance. Conducting benchmarking may also help in this evaluation process.
Power BI Table Partitioning
Power BI allows you to define multiple partitions on a table in Import mode, so that when the import is triggered Power BI will import each partition parallelly, effectively increasing the overall import performance. Here is the documentation on how to implement it.
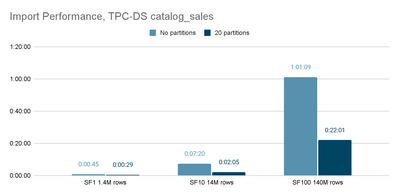
We tested this technique with Azure Databricks SQL and verified that this will actually increase import performance significantly. You can find below the difference in time we experienced in our internal tests.
In the screenshot you can see the time required to import the TPC-DS catalog_sales table of different sizes using different options. The conclusion here is that table partitioning can dramatically improve import performance of a single table on Power BI Premium SKUs. The total performance gain is higher for larger tables.
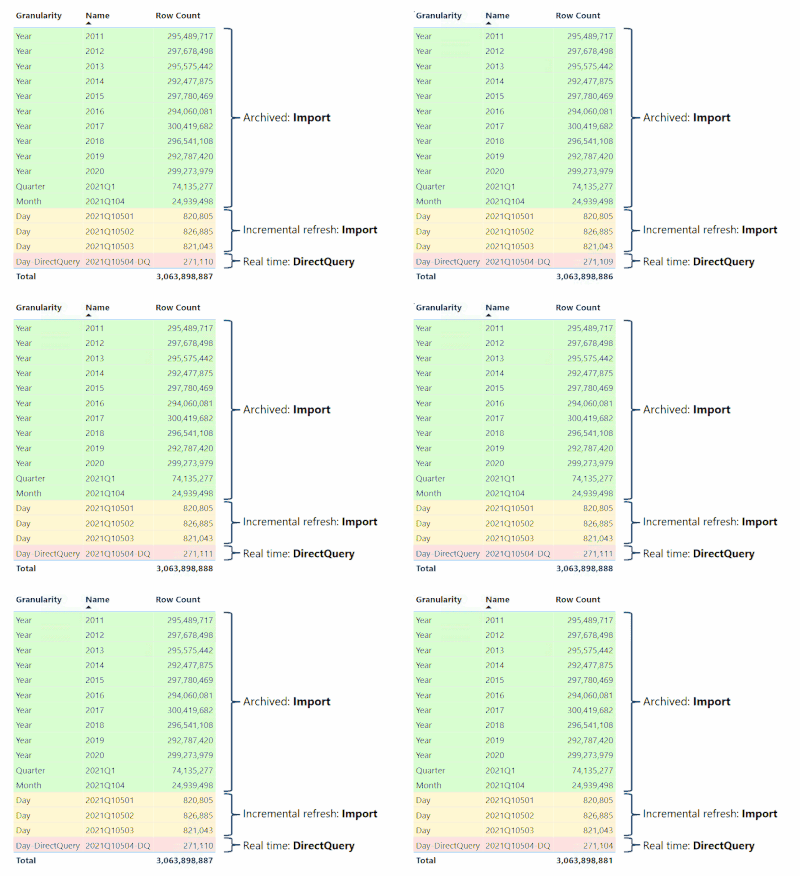
Incremental refresh can be used as an alternative to table partitioning. This enables faster and more reliable data refreshes as only recent data needs to be refreshed. This also reduces resource consumption and enables larger datasets.
Combining Import and DirectQuery mode partitions can even enable real-time BI scenarios.
Overall, this approach enables access to more up-to-date data, hence increasing the quality of data insights.
DirectQuery mode
When we use Direct Query, the characteristics of the queries being pushed down to source are different. Instead of seeing very simple queries that load the whole table, therefore having very large result sets, we tend to see more complex queries with smaller result sets. Power BI will generate a query that is as narrowed down as possible to what needs to be displayed on the dashboard.
To have a generic idea of how the Direct Query workload is different from Import mode, we can think of Import mode as being a single query per table that returns all records in a single table, while Direct Query triggers multiple queries returning generally smaller result sets (exceptions apply).
This means result sets are generally much smaller, and they can use the JDBC/ODBC channel only if results are smaller than 1MB, meaning we are looking at query performance in a very different way. Latency has almost no importance on the Import mode, in favor of data transfer and data ingestion performance, but with Direct Query, it’s actually the opposite: what we care the most is low query latency.
However, some limitations apply: Power BI triggers a separate query for every visual, and it can even trigger multiple queries for a single visual in some cases. This increases the overall response time by multiplying the query overhead.
Furthermore, there are a number of cases where Power BI will not push down the complexity of the query to the source and DAX query calculations are processed by Power BI engine after the query results are downloaded. In some cases, if the aggregation logic is not being pushed down for some reasons, we can see query failures when Power BI tries to pull more than 1 million rows from the source.
For example, let us consider the following DAX-measure in Power BI which calculates total sales over top 10 products.
Top10Sales = SUMX(
TOPN(
10,
SUMMARIZE(
catalog_sales,
catalog_sales[cs_item_sk],
"TotalSales", SUM(catalog_sales[cs_net_paid])
),
[TotalSales], DESC
),
[TotalSales]
)
In Azure Databricks SQL Query History, we can see that Power BI could not push down some of the business logic of this measure, specifically TopN calculation. The query retrieves a list of items with a simple aggregation. This can obviously lead to higher data retrieval durations and even failures on the Power BI side in case of 1M+ records resultsets.
select
`cs_item_sk`,
`C1`
from
(
select
`cs_item_sk`,
sum(`cs_net_paid`) as `C1`
from
`tpcds`.`sf1`.`catalog_sales`
group by
`cs_item_sk`
) as `ITBL`
where
not `C1` is null
limit
1000001
In Azure Databricks SQL query profile, we can see that the resultset contains 400,000+ records, and it took a few seconds to retrieve this resultset on the Power BI end.
This is clearly an example where the generated query to the source is suboptimal, but there are many other cases where Power BI generates pretty good SQL-queries. The general recommendation is to always look at generated queries in the Azure Databricks SQL Query History and, for corner cases like this, try to find a workaround also using some of the techniques mentioned in this article.
Query Parallelization for Direct Query Mode
Recently Microsoft has introduced significant query processing improvement around query parallelization in Power BI Direct Query mode, which can help to accelerate query response times for DAX and MDX expressions. This improvement can increase overall query performance by parallelizing as many storage engine (SE) queries per DAX or MDX query as possible, reducing the impact of data source delays and network latencies on query performance.
The benefits of using this feature include:
- Better report refresh time, hence better user experience.
- Reduced impact of data source delays and network latencies.
- Better utilization of cloud data warehouse horsepower.
Query Parallelization can be enabled by changing the following properties in your Power BI datasets:
- database.CompatibilityLevel >= 1569;
- model.MaxParallelismPerQuery > 1; (=1 equals to no parallelization)
Please note that MaxParallelismPerQuery may still be limited by DataSourceDefaultMaxConnections property. In other words, Power BI can run multiple queries simultaneously but the maximum number of connections to a data source does not allow opening more connections to execute all queries simultaneously.
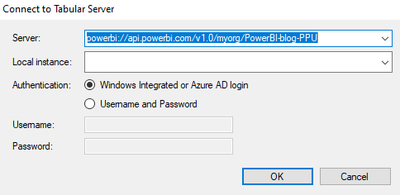
These properties can be set using TMSL, XMLA, or using tools such as Tabular Editor. Let’s consider below how to set these properties using Tabular Editor. First, connect to your Power BI workspace using XMLA-endpoint.
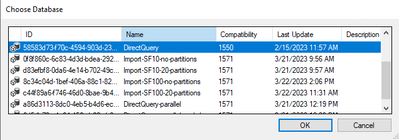
Then, choose Database (Power BI Dataset) which you would like to apply changes to.
Under Model→Basic→Database change Compatibility Level property to 1569 or higher.
And finally, under Model→Options change Max Parallelism Per Query to a value greater than 1.
Finally, save the changes to the connected database. You can find more details in Microsoft Power BI blog post.
Please note that there are limitations. For example, query parallelization is not available on Power BI Pro SKU and Power BI Premium SKUs with less than 8 vCores.
It is also important to take into consideration the “Maximum connections per data source” property which defines how many connections to a data source can be established simultaneously. Max Parallelism Per Query, Maximum connections per data source, and the capacity of your Azure Databricks SQL Warehouse should be well-aligned to achieve the best possible performance and user experience.
By fine-tuning the configuration of your datasets in Power BI, you can meet the query parallelization requirements in your environment, boosting the performance of your BI workloads in Direct Query mode.
Direct Query - sample setup
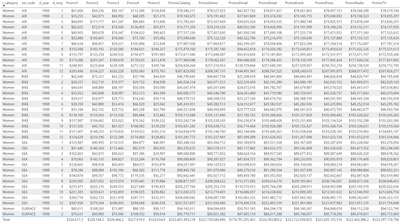
Our sample Power BI report is based on the TPC-DS dataset. Here, the main tables are catalog_sales and promotion. We will be analyzing sales amounts across various promotions.
The report is quite simple and contains the only plain table visual with multiple measures.
The measures are defined using following DAX-formulas:
// Basic measure - Sales Amount
SalesAmount = SUM(catalog_sales[cs_net_paid])
// Sales Amount filtered on a fact table column (surrogate key)
Promo1 = CALCULATE([SalesAmount], catalog_sales[cs_promo_sk]=1)
// Sales Amount filtered on dimension table column
PromoCatalog = CALCULATE([SalesAmount], promotion[p_channel_catalog]="N")
Direct Query - default/sequential
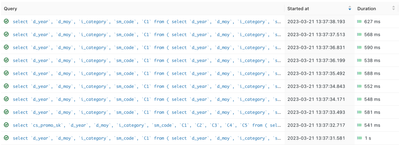
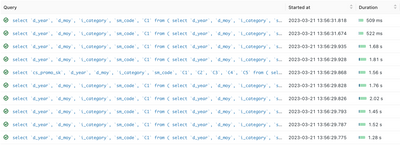
When using default settings, we can see that a single table visual triggers multiple SQL-queries sequentially. While Power BI managed to trigger only one query for the measures which use fact table column filters, it triggers multiple SQL-queries for the other measures where we have used dimension column filters. Apart from high workload on the data source, which is Azure Databricks SQL, this becomes even worse from end user experience because these queries are triggered sequentially, one by one.
We can see this on Azure Databricks SQL query history.
We can even see the same in DAX Editor using a more compelling timeline view.
As a result, the refresh time on a client browser is quite long, more than 15 seconds in this example.
Direct Query - query parallelization
After applying query parallelization in the Power BI dataset, we can see that SQL-queries are now triggered almost all at the same time, or in other words in parallel.
In DAX Editor we can see that the overall timeline has been dramatically decreased.
And expectedly the refresh time in the client browser is now also much faster, i.e. less than 4 seconds in this case.
Apart from improving report performance, hence user experience, this drives better resource utilization of Azure Databricks SQL clusters by pushing more queries simultaneously.
Combined with Azure Databricks SQL Serverless this can drive even better TCO by faster scale-in and -out based on actual workload demand.
Push complex formulas to Azure Databricks SQL
Azure Databricks SQL provides a powerful alternative to using the DAX processing engine of Power BI for complex formula calculations, offering significant performance gains in many cases. This can be achieved by using Databricks SQL's Native Query support or by creating a view.
By applying the aforementioned techniques, the calculation can be performed on the fly at querying time, leveraging Azure Databricks SQL query parallelization capabilities and improving performance significantly. Let’s consider a query pushdown optimization in the following example.
As we saw above, Power BI triggers separate SQL-queries for the measures where we use filters on dimension table columns. Hence, the idea to bring these filters directly into the fact table. In the following example we join the fact table with the dimension table and apply filters in a view.
create or replace view v_catalog_sales as
select
catalog_sales.*,
case when p_channel_catalog='N' then cs_net_paid else null end as cs_PromoCatalog,
case when p_channel_demo='N' then cs_net_paid else null end as cs_PromoDemo,
case when p_channel_dmail='N' then cs_net_paid else null end as cs_PromoDmail,
case when p_channel_email='N' then cs_net_paid else null end as cs_PromoEmail,
case when p_channel_event='N' then cs_net_paid else null end as cs_PromoEvent,
case when p_channel_press='N' then cs_net_paid else null end as cs_PromoPress,
case when p_channel_radio='N' then cs_net_paid else null end as cs_PromoRadio,
case when p_channel_tv='N' then cs_net_paid else null end as cs_PromoTV
from catalog_sales join promotion on cs_promo_sk = p_promo_sk;
Then we can replace the original fact table in our Power BI dataset with the new view and use new columns in the fact view to calculate required measures.
// Sales Amount filtered on dimension table column via a view
PromoCatalog = SUM(catalog_sales[cs_PromoCatalog])
Now in Azure Databricks SQL query history we can see that Power BI triggers only 2 SQL-queries which are triggered at the same time.
In DAX Editor we can see a similar picture. There are only 2 SE queries executed simultaneously.
As a result, the refresh time on a client browser is now less than 3 seconds.
As we could see in this example, by applying certain optimization techniques we have managed to improve report performance up to 5x times, from ~15s to less than 3 seconds.
This not only improves a single user experience. This improves overall TCO for customers by enabling a much higher number of concurrent users at the same Azure Databricks SQL compute capacity.
Wrap up
In conclusion, optimizing the performance of your Power BI dashboards requires a combination of techniques that are specific to your data and your visualizations. We have discussed a range of optimization techniques that can help you improve the performance of your dashboards, including optimizing your data model, using aggregations, and reducing the number of visuals on a page.
It is important to keep in mind that basic performance improvement best practices also apply, such as reducing the number of columns imported, as you're unlikely to use all 400 columns in your dashboard. Additionally, if your table size is close to the Power BI SKU limit for Import datasets, it probably makes sense to switch to Direct Query mode.
By implementing a combination of these techniques and following best practices, you can ensure that your Power BI dashboards deliver insights and value quickly and efficiently. Keep in mind that optimizing for performance is an ongoing process, and you may need to revisit your optimization strategy as your data changes and your needs evolve. Ultimately, the goal is to provide your users with an experience that is fast, intuitive, and valuable. So, make sure you utilize basic performance improvement best practices alongside the techniques we have discussed here to ensure your dashboard performs at its best.
Furthermore, you should consider reviewing the performance of your data lake to make sure queries are processed as fast as possible. Our next blog post will address common best practices to optimize your Lakehouse and Azure Databricks SQL for BI tools.
In our next blog post "Power Up your BI with Microsoft Power BI and Lakehouse in Azure Databricks: part 3 - Tuning Azure Databricks SQL" we will focus on tuning Azure Databricks SQL Warehouse performance. Stay tuned!
And in case you missed it, read Part 1: Power Up your BI with Microsoft Power BI and Azure Databricks Lakehouse: part 1 - Essentials

