This post has been republished via RSS; it originally appeared at: New blog articles in Microsoft Community Hub.
Azure Load Testing is a fully managed load testing service that enables you to easily generate high scale load and gain actionable insights into the performance and scalability of your applications. Customers benefit from Azure Load Testing (ALT) because the service abstracts away the environment setup and teardown, needed for high scale loads; and simplifies the analysis of the test results through the built in test criteria and integrated results dashboard. In this blogpost, we will demonstrate how you can gain more benefit from the automation and customization options provided by the service. If you haven’t used the service yet, you can get started and run your first load test in less than 10 minutes.
Amidst the regular updates to applications in the form of new features, bug fixes, architectural improvements etc., Azure Load Testing customers ensure that app resiliency in an automated manner by integrating load testing with their CI/CD process. However, there may be scenarios where you need to automatically run load tests outside CI/CD. For example,
- You need to run performance tests periodically (daily or weekly) to ensure consistency in your endpoint performance.
- Performance of your application depends on an open-source API or a third-party API and the API goes through frequent updates. So, you need to periodically monitor your application performance.
- You have a need to run multiple load tests at the same time – to simulate load from multiple geographies, to generate very high scale load etc.
While the service greatly simplifies your performance testing journey, you may be thinking that manual intervention is needed for such scenarios. Well, that’s not true; a one-time set up using the Azure Load Testing SDKs or REST APIs can automate this process end-to-end.
Let’s take a sample scenario and see how this can be done.
Test scenario
Let’s use the sample web application and test scenario that we discussed in a previous blogpost - Automated and customized dashboards for Azure Load Testing (microsoft.com). In our test scenario, we have a sample .NET Podcast web application and we have created a load test using JMeter to track the performance of three specific pages in this application – Homepage, Discover page and page, when 500 concurrent users use this application for 5 minutes.
If you have tried out the scenario from the blogpost, you can find the test created under Tests on your Azure Load Testing resource.
If you haven’t yet, you can follow the instructions in the blogpost and use the artifacts from the samples repository to set up the load test in Azure Load Testing.
Automatically run tests and update dashboard
Now that we have the test set up, we’d like to run this test periodically and update a custom dashboard with the test run results. This can be achieved in four simple steps.
- Run the load test that we created for our test scenario, using ALT Python SDK.
- Get the test run results in the form of a CSV file.
- Upload the CSV file to a blob storage container by using the Azure Storage SDK.
- Connect the PowerBI dashboard, with required visualizations, to read data from the blob storage container.
A sample Python script for steps 1 through 3 is available here. This script takes all the required inputs from a config file and does not ask for any inputs at run time. This gives us the flexibility to run it on schedule without any manual intervention.
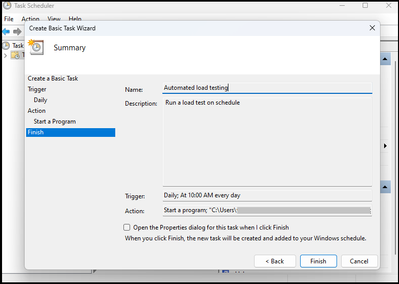
We can now schedule the script to run periodically as required. Here, for simplicity, we have used to run the script every day at a specific time. For more reliability and flexibility in running the script on a schedule, you can use services like Azure Functions, Azure Logic Apps, Azure Pipelines, Microsoft Power Automate etc.
We are now running our load test on a schedule, and we have our test results flowing into an Azure storage account. Following the same pattern as our earlier blogpost, we can create a PowerBI dashboard to visualize the results data from the storage account.
Here is a sample PowerBI report from five test runs of the load test against our podcast application. The PowerBI template used is available here.
This dashboard can be used to monitor the performance trends of the web application and take any corrective action.
You can replicate the same for your test runs in Azure Load Testing in 3 simple steps –
- Download the Python script, config file and update the load testing inputs – Subscription ID, Resource name etc. in the config file.
- Create a container in a storage account and update the storage account inputs in the config file.
- Download the PowerBI template and update the connection settings to point to your storage account.
The resources used for this sample scenario are available in the Azure Load Testing samples repository.
To recap, we have set up a Python script using Azure Load Testing SDKs to run a load on schedule and push the results to an Azure storage account. We have a PowerBI dashboard set up to visualize the performance test results. You now know how to run load tests on schedule using Azure Load Testing and visualize the results in a dashboarding tool of your choice.
If you have any feedback on Azure Load Testing, let us know through our feedback forum. Refer to the previous blogposts on Azure load testing here.


