This post has been republished via RSS; it originally appeared at: Microsoft Tech Community - Latest Blogs - .
Profiling AI/ML models is a pivotal step in harnessing the full potential of computational resources, especially when deploying on high-performance platforms like single/multi-GPUs. This process delves deep into the model's performance metrics, revealing critical bottlenecks and areas of underutilization that could be hindering optimal operation. Through profiling, developers can garner actionable insights such as the need to enable XLA for TensorFlow computations or adjusting the batch size to enhance data throughput and GPU memory utilization. Furthermore, profiling sheds light on GPU underutilization issues, guiding on necessary adjustments to the data loading pipeline, thus paving the way for refined, efficient AI/ML model performance. This meticulous analysis is indispensable for tackling complex, large-scale computational tasks, ensuring resources are judiciously utilized to accelerate the journey from model development to delivering real-world solutions.
AzureHPC images significantly streamline the setup process for high-performance computing (HPC) environments on Azure, pre-embedding essential drivers, libraries, and tools needed for leveraging the power of HPC. This includes preinstalled GPU/network drivers and CUDA libraries which are critical for accelerating computing tasks. The inclusion of Docker simplifies containerization, ensuring a consistent runtime environment, thus aiding in the deployment and scaling of applications. The images also come with NVIDIA's debugging and profiling tools like Nsight Compute and Nsight Systems, instrumental in optimizing the performance of AI/ML models on GPUs.
DLProf, short for Deep Learning Profiler, is a robust tool crafted for profiling deep learning models, aiding data scientists in understanding and boosting their models' performance. The profiler can discern if an operation can utilize Tensor Cores and if such kernels are being executed. It supports multiple deep learning frameworks, facilitating profiling across different frameworks by selecting the requisite profile mode. DLProf comes with a custom viewer, generating a database that can be analyzed using NVIDIA's DLProf Viewer in a web browser. It also supports multi-GPU profiling, enhancing its versatility. A notable feature is Iteration Detection, allowing performance analysis across different iterations by specifying a key node. DLProf uses NVTX markers for time correlation between CPU and GPU with model operations, enhancing the analysis accuracy. It can generate diverse reports aggregating data based on operations, iterations, or layers, in JSON or CSV formats. The Expert Systems feature identifies common improvement areas and bottlenecks, providing suggestions to ameliorate performance issues. DLProf fully supports analyzing XLA compiled TensorFlow models, and the inclusion of custom NVTX markers and domains, alongside the ability to profile with a delay and specified duration, rounds off its comprehensive profiling capabilities.
DLProf supports TensorFlow1, TensorFlow2, and PyTorch. It can be installed using PythonPIP Wheel (does not support TensorFlow2), or directly accessed by NVIDIA NGC containers. Note that DLProf can profiles code with single/multi-GPUs on a single node, but not on multiple nodes. In this blog, we will profile a Tensorflow2 code on two A100 80G GPUs using the NGC TF2 image.
Pull the NGC image
Prior to retrieving a container from the NGC container registry, it's imperative to have Docker and nvidia-docker installed. For DGX users, the installation process is elucidated in the 'Preparing to use NVIDIA Containers Getting Started Guide'. For non-DGX users, the nvidia-docker installation documentation should be referred to, for installing the latest versions of CUDA, Docker, and nvidia-docker.
Since the AzureHPC image already have Docker environment setup, we can pull the image using command below:
# Pull the image from NGC
docker pull nvcr.io/nvidia/tensorflow:21.07-tf2-py3

# Check the pulled image
docker images
REPOSITORY                                  TAG             IMAGE ID       CREATED        SIZE
nvcr.io/nvidia/tensorflow                   21.07-tf2-py3   887093b5693e   2 years ago    11.1GB
Start the NGC container
Once the container is pulled from NGC, we need to launch it with the following command. Note we need to bind host port 8000 to that of the container if you would like to view the profiling report from the VM browser.
docker run --rm --gpus=2 --ipc=host --shm-size=1g\
  --ulimit memlock=-1 --ulimit stack=67108864 -it -p 8000:8000 -v \
  /PATH/TO/YOUR/DATA:/data \
  nvcr.io/nvidia/tensorflow:21.07-tf2-py3
Launch profiling session
To profile a TF2 code either on single or multi-GPU, no changes need to be made to your Python code. A primary objective of DLProf is to streamline and automate the profiling process. In its most basic usage, a user only needs to prefix the training script with dlprof. Note for PyTorch users, nvidia_dlprof_pytorch_nvtx blocks need to be inserted. We can launch the profiling session with the command below.
dlprof --force=true --nsys_opts='-t cuda,nvtx,cublas,cudnn -s none' \
  -m tensorflow2 python train.py

# Explanations of the flags
-f, --force=
   Possible values are 'true' or 'false'.
   If true, overwrite all existing result files
   with the same output filename (QDSTREM, QDREP,
   SQLITE, CSV, JSON).
   Default is 'false'.
--nsys_opts=
   Specify nsys args within quotes '"[<nsys args>]"'.
   Customize the args passed to Nsight Systems.
   Option must include the default for DLProf to
   operate correctly.
   Default arguments are '"-t cuda,nvtx -s none"'.
-m, --mode=
   Possible values are 'simple', 'tensorflow2', 'tensorrt'.
   Specify the target framework being profiled. Use
   'simple' to generate only high level metrics agnostic
   to any framework. Use all other options to
   generate detailed metrics and reports specific to
   the framework.
   Default is 'tensorflow2'.

# Options from `nsys profile --help` related to `--nsys_opts`
-t, --trace=
   Possible values are 'cuda', 'nvtx', 'osrt', 'cublas', 'cudnn', 'opengl', 'opengl-annotations', 'mpi', 'oshmem', 'openacc', 'openmp', 'vulkan', 'vulkan-annotations' or 'none'.
   Select the API(s) to trace. Multiple APIs can be selected, separated by commas only (no spaces).
   If '<api>-annotations' is selected, the corresponding API will also be traced.
   If 'none' is selected, no APIs are traced.
-f, --force=
   Possible values are 'true' or 'false'.
   If true, overwrite all existing result files
   with the same output filename (QDSTREM, QDREP,
   SQLITE, CSV, JSON).
   Default is 'false'.
-s, --sample=
   Possible values are 'cpu' or 'none'.
   Select the entity to sample. Select 'none' to disable sampling.
   Default is 'cpu'. Application scope.
Command line output from DLProf
Processing events...
Saving temporary "/tmp/nsys-report-4817-75a0-f379-4106.qdstrm" file to disk...

Creating final output files...
Processing [==============================================================100%]
Saved report file to "/tmp/nsys-report-4817-75a0-f379-4106.qdrep"
Exporting 10995948 events: [==============================================100%]

Exported successfully to
/tmp/nsys-report-4817-75a0-f379-4106.sqlite
Report file moved to "/data/./nsys_profile.qdrep"
Report file moved to "/data/./nsys_profile.sqlite"

[DLProf-02:53:59] DLprof completed system call successfully
2023-10-04 02:54:31.055796: I tensorflow/stream_executor/platform/default/dso_loader.cc:53] Successfully opened dynamic librar
y libcudart.so.11.0
[DLProf-02:54:32] Initializing Nsight Systems database
[DLProf-02:56:03] Reading System Information from Nsight Systems database
[DLProf-02:56:03] Reading Domains from Nsight Systems database
[DLProf-02:56:03] Reading Ops from Nsight Systems database
[DLProf-02:57:45] Reading CUDA API calls from Nsight Systems database
[DLProf-02:59:58] Correlating network models with kernel and timeline data
[DLProf-02:59:58] Found 1 iteration using key_node ""
Iterations: [86461724964]enacc', 'openmp', 'vulk
Aggregating data over 1 iteration: iteration 0 start (0 ns) to iteration 0 end (86461724964 ns)

[DLProf-02:59:59] Aggregating profile data
[DLProf-03:01:03] Creating dlprof database at ./dlprof_dldb_1.sqlite
[DLProf-03:01:03] Writing profile data to dlprof database
[DLProf-03:03:19] Writing aggregated data to dlprof database
[DLProf-03:04:46] Writing expert_systems report to (stdout)
Expert Systems Feedback: 5 issues detected. Note that expert systems is still experimental as are all recommended changes

Problem detected:
  XLA is not enabled: No XLA ops detected
Recommended change:
  Try enabling XLA. See https://www.tensorflow.org/xla/#enable_xla_for_tensorflow_models for information on how to enable XLA.

Problem detected:
  22 ops were eligible to use tensor cores but none are using FP16
Recommended change:
  Try enabling AMP (Automatic Mixed Precision). For more information: https://developer.nvidia.com/automatic-mixed-precision

Problem detected:
  The GPU is underutilized: Only 4.3% of the profiled time is spent on GPU kernel operations
Recommended change:
  "Other" has the highest (non-GPU) usage at 67.8%. Investigate the dataloading pipeline as this often indicates too much time
 is being spent here

Problem detected:
  Unable to split profile into training iterations: key node  not found
Recommended change:
  Specify key node by setting the --key_node argument

Problem detected:
  GPU Memory is underutilized: Only 2% of GPU Memory is used
Recommended change:
  Try increasing batch size by 4x to increase data throughput
The profiling gives the performance suggestions summarized below:
- Enable XLA to optimize TensorFlow computations.
- Activate AMP (Automatic Mixed Precision) to leverage tensor cores with FP16.
- Address GPU underutilization by investigating and optimizing the dataloading pipeline.
- Boost data throughput by quadrupling the batch size to better utilize GPU memory.
After the profiling is done, three files are generated.
- nsys_profile.qdrep: The QDREP file is generated by Nsight Systems and can be opened in the Nsight Systems GUI to view the timeline of the profile.
- nsys_profile.sqlite: A SQLite database of the profile data that is used by DLProf.
- dlprof_dldb.sqlite: The DLProf database that is used in the DLProf Viewer.
Start DLProfView
We can visualize the profiling results using DLProfView. First, we need to start the server with the command below:
dlprofviewer -b 0.0.0.0 dlprof_dldb.sqlite
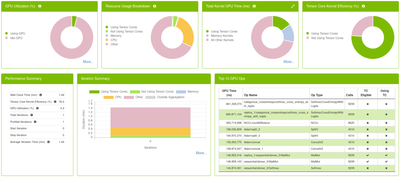
In your browser, go to http://localhost:8000. The profiling summary looks like below. It shows a high level view of GPU utilization.
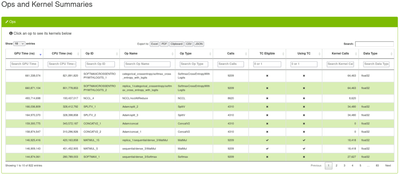
We can take a deeper look at the operations and kernel activities by switching to the Ops and Kernel Summaries tab. It shows the GPU/CPU time, number of calls, and data type for all operations. The most time consuming operations in this test is SoftMax, NCCLAllReduce, and Adam optimization.
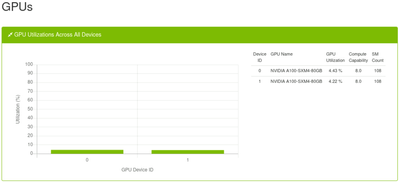
If you are profiling multiple GPUs, you can see the utilization of each GPU.
Drill deeper using Nsight System
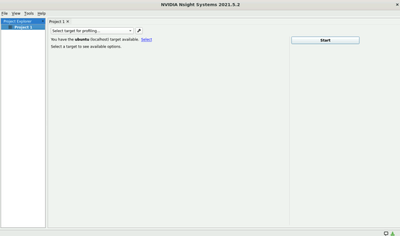
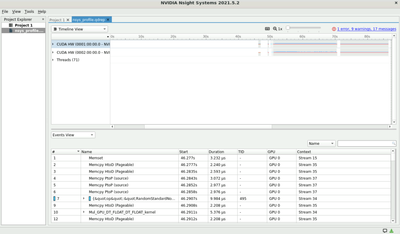
The AzureHPC image comes with Nsight Systems and Nsight Compute pre-installed. To view the profiling results using Nsight Systems, find the app and open it from your Desktop.
As part of the profiling process, a .qdrep file was generated. Find and load this file into the Nsight Systems app.
Once the loading is done, we can observe the timeline of the computations on the top panel. We can optionally open the events view on the bottom session.
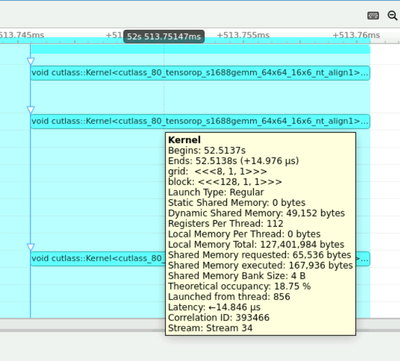
To gain further details on the profiling results. We can zoom in into the timeline. The first problem we can observe is the Device to Host Memcpy operation that is happening between the training batches. This inidicates the data loading process needs to be optimzied. Instead of sending data between the device and host, all computations should be done on the GPU.
Another observation is the low Theoretical occupancy in some of the kernel calls, which indicates low utilization of the GPUs. Ideally we would like to see at least 50% of Theoretical occupancy.
Improvement Suggestions
-
Transition to GPU-native Libraries:
- Adopt GPU-native libraries such as NVIDIA RAPIDS to better leverage GPU resources. For example, if you are using scikit-learn and pandas in your Python code, replace them with cuML and cuDF respectively to accelerate data processing and machine learning tasks.
-
Optimize Data Loading and Memory Transfers:
- Investigate and optimize the data loading pipeline to eliminate bottlenecks contributing to low GPU utilization. Minimize or eliminate unnecessary Device to Host memory transfers to ensure computations are predominantly performed on the GPU.
-
Enhance Batch Processing and Kernel Occupancy:
- Increase the batch size to augment data throughput and better utilize GPU memory. Explore optimizing kernel configurations to improve theoretical occupancy, ensuring better GPU resource utilization.
-
Enable Advanced GPU Features and Regular Profiling:
- Activate Automatic Mixed Precision (AMP) and XLA for TensorFlow to accelerate training and optimize computations. Continually profile the workflow using tools like DLProf and Nsight Systems to identify and rectify performance issues timely.
These consolidated suggestions should provide a structured approach towards addressing the observed low GPU utilization and enhancing the overall performance of your AI/ML models on AzureHPC images.
Conclusion
Through profiling on AzureHPC images, we identified and addressed critical bottlenecks, notably by transitioning to GPU-native libraries and optimizing data pipelines. Utilizing tools like DLProf and Nsight Systems facilitated a deeper understanding and rectification of performance hindrances. This iterative process of profiling and optimization is indispensable, enabling us to fully leverage GPU capabilities, accelerate AI/ML tasks, and drive toward more efficient and insightful solutions.

