This post has been republished via RSS; it originally appeared at: New blog articles in Microsoft Community Hub.
What is the Azure App Service?
Azure App Service is a fully managed platform as a service (PaaS) for building, deploying, and scaling web, mobile, API, and even serverless apps. In this article, you will learn all about App Service by deploying an ASP.NET Core app to Azure App Service Web Apps. You will also use a variety of services to monitor the app, including the Application Performance Management service called Application Insights.
Objectives
Upon completion of this article, you will be able to:
- Explain and create App Service plans and App Services.
- Understand the available App Service Web Apps deployment options
- Use deployment slots for zero-downtime deployments.
- Monitor Web Apps using metrics, logs, and application insights.
Prerequisites
You should be familiar with:
- General software development and DevOps principles
- Familiarity with the Azure Portal
How to create an Azure App Service Plan and Web App
App Service is a fully managed platform as a service (PaaS) for building, deploying, and scaling web, mobile, API, and even serverless apps.
In this exercise, you will create an App Service plan and a web app.
- In the Azure Portal, click Create a resource and search for App Service Plan.
- Click Create.
- In the App Service Plan blade, enter the following information:
- Subscription: Select your subscription.
- Resource group: Select your existing resource group or create a new one.
- Name: Enter a unique name for your App Service plan.
- Operating System: Select Windows.
- Location: Select the location you used in the previous exercise.
- Pricing tier: Select S1.
- Size: Select s1.
- Runtime stack: Select .NET Core 6.0 (LTS).
- Region: Select a region.
- Review and Create: Click Review and Create.
How to create a web app staging deployment slot
Deployment slots are live apps with their own hostnames. App content and configuration elements can be swapped between two deployment slots, including the production slot. Deploying an app to a slot first and swapping it into production ensures that all instances of the slot are warmed up before being swapped into production. This eliminates downtime when you deploy. The traffic redirection is seamless, and no requests are dropped as a result of swap operations. Slot swaps are free.
- In the Azure Portal, navigate to your App Service plan and click Deployment slots.
- There is a default slot called production.

- Click Add Slot.
- In the Add a slot blade field, enter the following information:
- Name: Enter a unique name for your slot.
- Deployment slot setting: Select Do not clone.
- Save: Click Save.
You should now see your new slot in the list of deployment slots.
- Click on the new slot to open the deployment slot blade. You should see a similar screen as the production slot, but the URL will be different.
How to Deploy an Application (ASP.NET Core) to Azure App Service
In this exercise, you will deploy an ASP.NET Core app to the Azure App Service. We will be using Kudu for uploading our application; alternatively, you can use Azure App continuous deployment support with your git provider.
- In the Azure Portal, navigate to your App Service plan and click Deployment slots.
- Click on the staging slot to open the Deployment slot blade.
- From the Development Tools section, click Advance Tools.
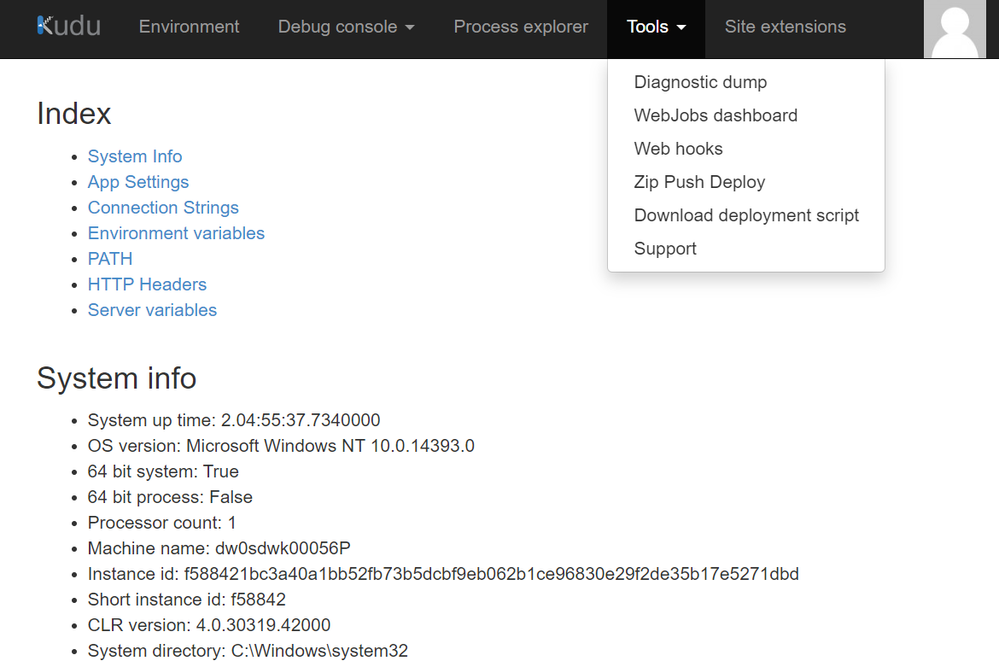
- In the Advanced Tools blade, click Go. The Kudu console will open in a new tab. Kudu is the engine behind Git deployments in the Azure App Service. We will use it to deploy our app.
- In the Kudu console, click Tools and then Zip Push Deploy.
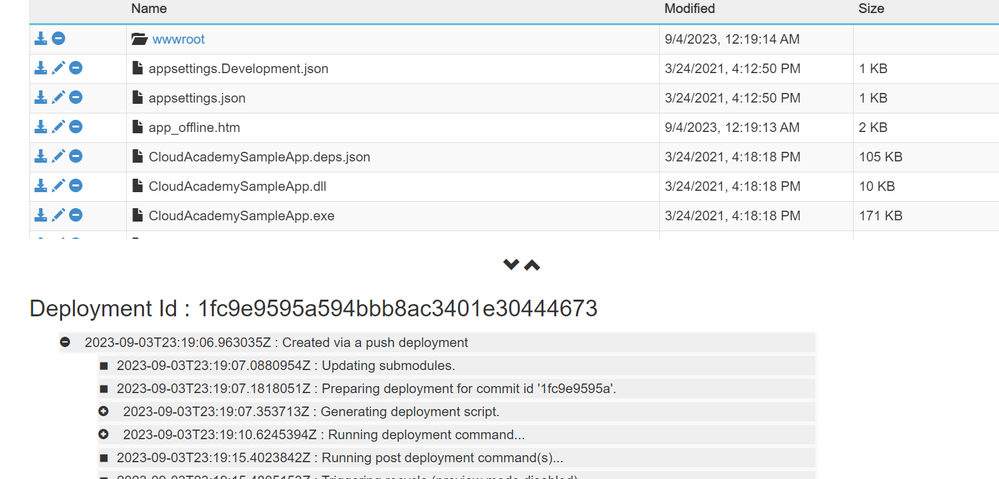
- In the Zip Push Deploy blade, drag and drop the app.zip file attached to this blog into the drag-and-drop zip file area.
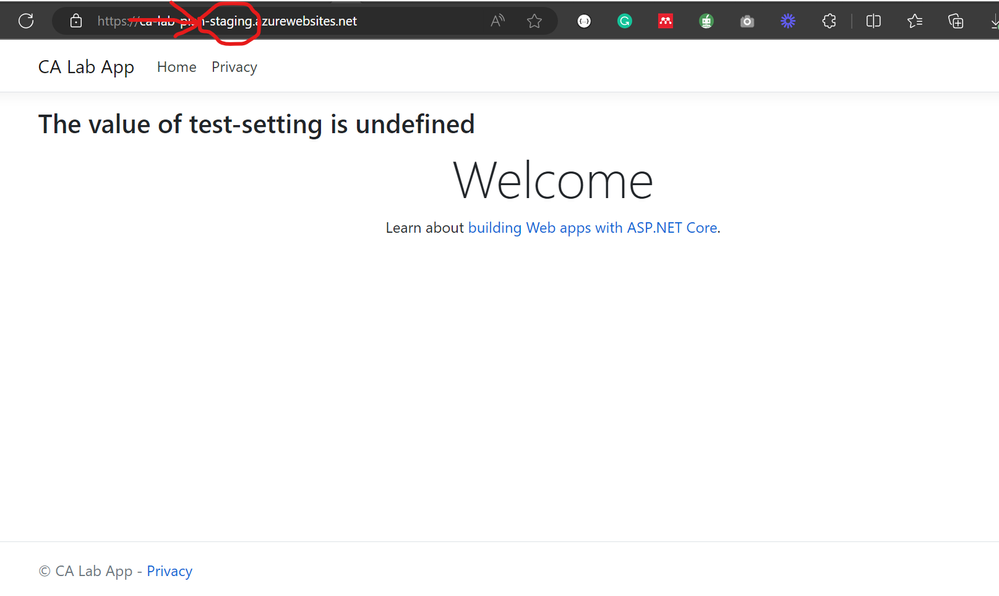
- Once the deployment is complete, navigate to the URL of your staging slot. You should see the following page:
How to configure Azure web App applications and environment settings
The application requires an environment variable to remove the undefined text and we need to configure the application settings required by the code to remove the undefined text.
- Go to the Configuration section of the Deployment slot blade.
- Click New application setting.
- In the Add application setting blade, enter the following information:
- Name: Enter test-settignsT.
- Value: Enter blue.
- OK: Click OK.
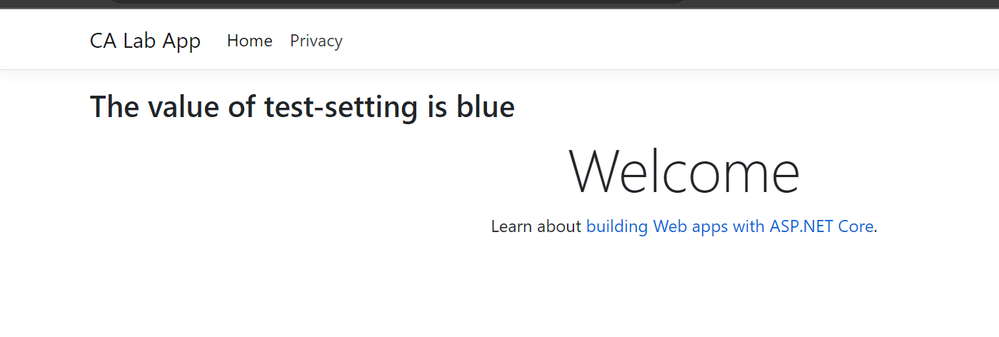
- Navigate to the URL of your staging slot. You should see the following page:
How to Swap deployment slots in azure app service
In this exercise, you will swap the staging slot for production.
This will make the staging slot the production slot, and the production slot the staging slot.
- From the Deployment slot blade, click Swap.
- In the Swap blade, enter the following information:
- Source: Select the stagging app.
- Destination: Select the production app.
- Swap type: Select Swap.
- Swap with preview: Select Yes. The preview will show you the changes that will be made to the production slot.
- Start Swap: Click Start Swap.
Once the swap is complete, before clicking on the Complete Swap button, navigate to the staging URL of your slot. You should see a preview of the production deployment. Notice the undefined text reappears; that is because the application setting is not configured in the production slot.
- Next, click on the Complete Swap button.
How to monitor Azure Web Apps using metrics, logs, and Application Insights
Monitoring is a critical part of any application. In this exercise, you will learn how to monitor your Web App using metrics, logs, and application insights.
How to Monitor Azure web apps using metrics
- From the App Service blade, click Metrics.
- In the Metrics blade, click Add metric chart.
- In the Add metric chart blade, enter the following information:
Connections - scope: Select the production app.
- Metric Namespace: Select App Service
- Metric: Select Connections
- Add metric: Click Add metric
HTTP 2xx
- scope: Select production app.
- Metric Namespace: Select App Service.
- Metric: Select HTTP 2xx
- Add metric: Click Add metric
HTTP Server Errors
- scope: Select production app.
- Metric Namespace: Select App Service
- Metric: Select HTTP Server Errors
- Add metric: Click **Add metric**
Thread Count
- scope: Select production app.
- Metric Namespace: Select App Service
- Metric: Select Thread Count
- Add metric: Click Add metric
- Save and close the metric chart.
You should now see the metrics chart on the Metrics blade.
How to Monitor Azure web apps using logs
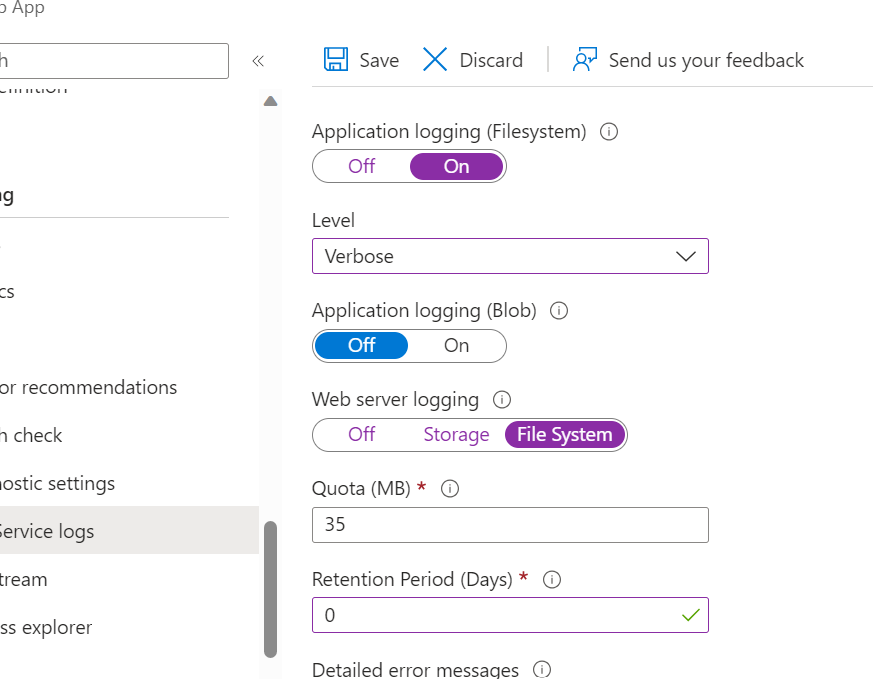
- From the App Service blade, click App Service Logs.
- In the App Service Logs blade, carry out the following configuration as the image below:
- Click Save.
- From the App Service blade, click Log stream.
- Application logs will be displayed in the Log stream blade. These logs are useful for debugging your application.
- Server logs will be displayed in the Log stream blade. These logs are useful for debugging your application.
How to Monitor Azure web apps using Application Insights
Application Insights is an extensible Application Performance Management (APM) service for web developers on multiple platforms. Use it to monitor your live web application. It will automatically detect performance anomalies. It includes powerful analytics tools to help you diagnose issues and to understand what users actually do with your app. It's designed to help you continuously improve performance and usability. It works for apps on a wide variety of platforms including .NET, Node.js and J2EE, hosted on-premises or in the cloud. It integrates with your DevOps process, and has connection points to a variety of development tools. It can monitor and analyze telemetry from mobile apps by integrating with Visual Studio App Center.
- From the Azure Services, click Application Insights or search from the portal.
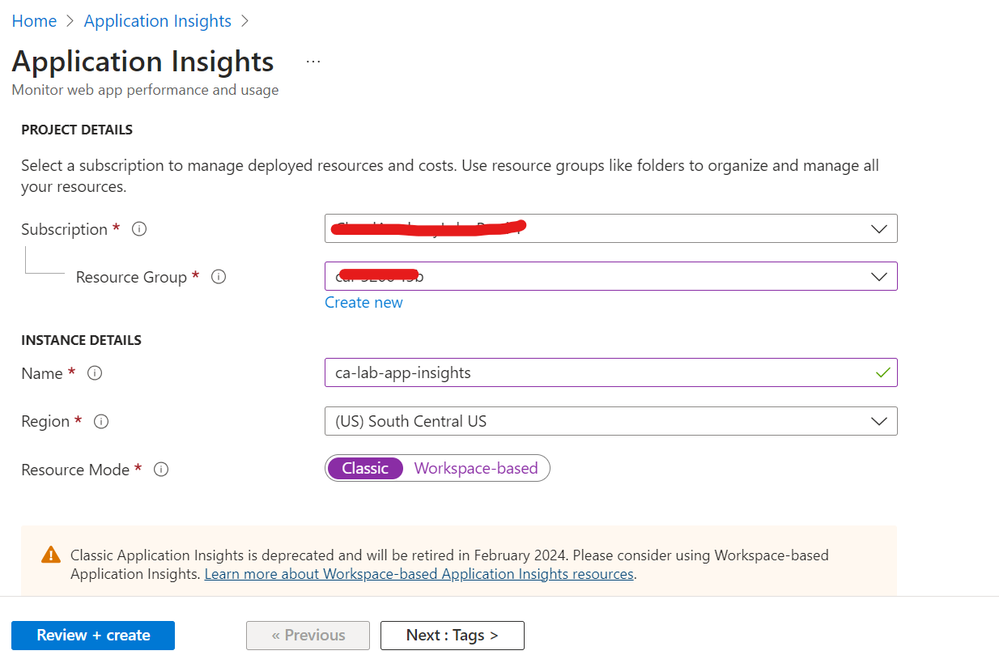
- In the Application Insights blade, click Create.
- In the Create Application Insights blade, enter the following information:
- Subscription: Select your subscription.
- Resource group: Select your existing resource group or create a new one.
- Name: Enter a unique name for your Application Insights.
- Region: Select the location you used in the previous exercise.
- Resource Mode: Select Classic.
- Review and Create: Click Review and Create.
- Once the Application Insights is created, navigate to the App Service Production Slot blade.
- In the App Service Production Slot blade, click Application Insights.
- In the Application Insights blade, click Turn on Application Insights.
- In the Turn on Application Insights blade, select the Application Insights you created in the previous step under Resource.
- Click Apply.
- Navigate to the Application Insights resource.
- Carry out some operations on the production URL of your app by clicking on some links and checking the Application Insights blade for the data.
- In the Application Insights blade, click Transaction Search and search for `Home` or search all.
- Go back to the Overview blade and click Logs. Log Analytics allows you to run SQL-like queries over your Application Insights data.
- Close the welcome screen and enter the following query in the query editor:
- This query will return all the page views for your app.
- Click Run.
- Click the chart icon to view the data in a chart.
- Click Save to save the query.
How to Check Azure Web Application Health
- From the App Service blade, click Resource Health under Monitoring.
- In the Resource Health blade, you will see the health of your Web app. If there are any issues, you will see them here.
Conclusion
In conclusion, mastering the deployment and monitoring of web applications in Azure App Service is essential for ensuring a seamless and efficient user experience. By understanding the nuances of App Service plans and deployment options and utilizing deployment slots intelligently, we can achieve zero-downtime deployments, enhancing the reliability of our applications. Furthermore, the robust monitoring capabilities provided by Azure, including metrics, logs, and Application Insights, empower us to proactively identify issues, optimize performance, and deliver top-notch user satisfaction. This knowledge not only streamlines development processes but also plays a pivotal role in shaping a successful DevOps strategy, ensuring that our web applications are always up and running, meeting the highest standards of quality and reliability.
Remember to destroy the resources when they are no longer needed to avoid incurring unnecessary costs.
Credit
This article is inspired by a lab as part of the cloud academy Azure Solution Architect learning path. The platform provided hands-on guidance and training on cloud technologies.
Additional Resources
Explore Azure App Service - Training | Microsoft Learn
Configure web app settings - Training | Microsoft Learn
Scale apps in Azure App Service - Training | Microsoft Learn
Explore Azure App Service deployment slots - Training | Microsoft Learn


