This post has been republished via RSS; it originally appeared at: Microsoft Tech Community - Latest Blogs - .
In this blog post, we’ll take a closer look at performance benchmark results from target-based scaling for Azure Logic Apps Standard, and how it can help you manage your application’s performance with asynchronous burst loads. In this scenario, an HTTP request with a batch of 1 million messages invokes a process that fans out and processes the messages in parallel.
Workflow
The scenario is implemented using a single Logic App Standard App, which has elastic scale-out maximum burst instances configured to 100, and contains two workflows:
- Dispatcher – a stateful workflow using an HTTP trigger with SplitOn configured. It receives 10 arrays of 100k messages (1M total) in the request body to split on, and for each message, it invokes a stateless child workflow (Enricher)
- Enricher – A stateless workflow used for data processing. It contains data composition, data manipulation with inline JavaScript, outbound HTTP calls to a Function App, and various control statements.
Having the parent workflow as a stateful facilitates scaling out to multiple instances and distributing parent workflow runs across them. Having the data processing workflow as stateless allows messages to be processed with lower latency while achieving higher throughput.
For more information on the workflows, please refer to this blog post.
Results
In this section we compare the performance of the solution running under Target Based Scaling model, compared to the same solution running under the Incremental Scaling model.
Execution Elapsed Time
The chart below represents the total time take to process a batch of 1M messages, when using target-based and incremental scaling, respectively:
|
Type of Scaling |
Execution Elapsed Time (min) |
|
Incremental |
132 |
|
Target-Based Scaling |
102 |
The workflow with target-based scaling enabled was able to drain the messages ~30% faster compared to incremental scaling.
Scaling Profile
The scaling profile shows how each app scaled overtime to meet the workload burst.
Scaling Profile per app - 1M Messages
Allocated Instance Count per app - 1M Messages
The table below shows the peak and average instance counts for each scaling logic to meet the 1M batch workload:
|
Type of Scaling |
Number of instances (sum) |
|
Incremental |
8477 |
|
Target-Based |
8062 |
The diagram and table above show some interesting points:
- The time it takes to scale out to the required number of instances has halved with target-based scaling.
- The total number of instances used to drain the messages in the queue for target-based scaling is less than of incremental scaling.
- Although the average and peak of number of instances allocated to the app with target-based scaling is higher than of the app with incremental scaling, target-based scaling provides a reduction in the total number of instances used to drain the message queue.
Target-based scaling not only provides an improved performance benchmark for the Logic app, but also introduces a cost-efficient method of handling asynchronous burst loads.
Execution Throughput
Execution Count per App
Execution rate ramps up to about 500k/min in ~30 min with target-based scaling, whereas this value stays at ~1 hour for incremental scaling.
Action Count per App
Both apps ramp up to a sustained action execution rate of 350K actions/min, this rate is reached within about 35 mins for target-based scaling, where it took ~1 hour for incremental scaling to reach the same execution rate.
Execution Delay (95th percentile)
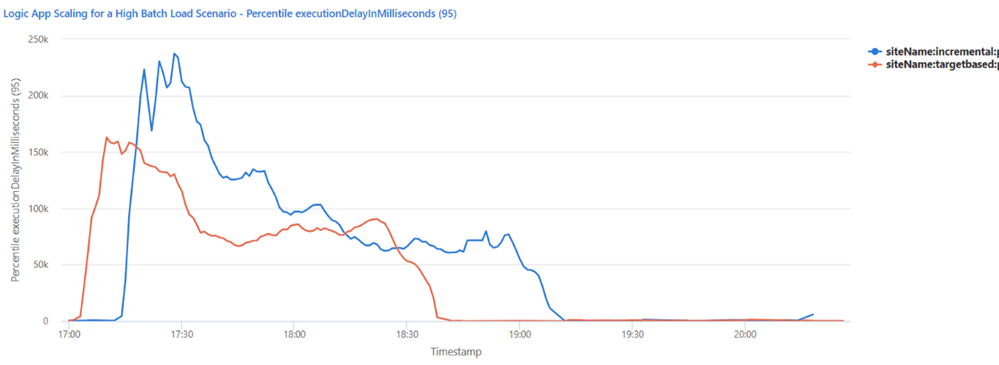
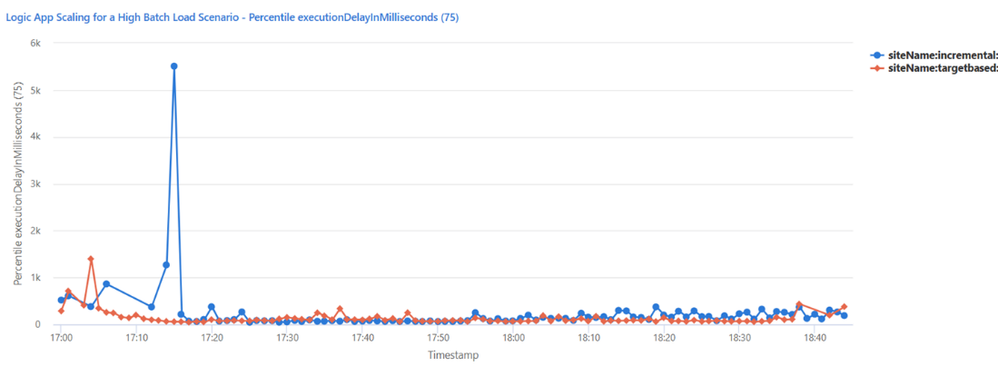
Execution delay is the measure of when a job is scheduled to be executed versus when it was actually executed. It is important to note that this value will never be zero, but a higher execution delay indicates that system resources are busy, and jobs must wait longer before they can be executed. For Logic Apps, an execution delay of 200ms or less is optimal.
Execution Delay (95th percentile)
Execution Delay (75th percentile)
One point to notice from the graphics above is how much the execution delay improves when using target-based scaling, compared to incremental scaling. While 95th percentile execution delay for the app with incremental scaling peaks at 237,000ms, this number sits at 162,000ms for target-based scaling. Similar results are obtained for 75th percentile execution delay, with incremental scaling enabled app peaking at 5,498ms, which is significantly reduced with the use of target-based scaling, resulting at 1,397ms.
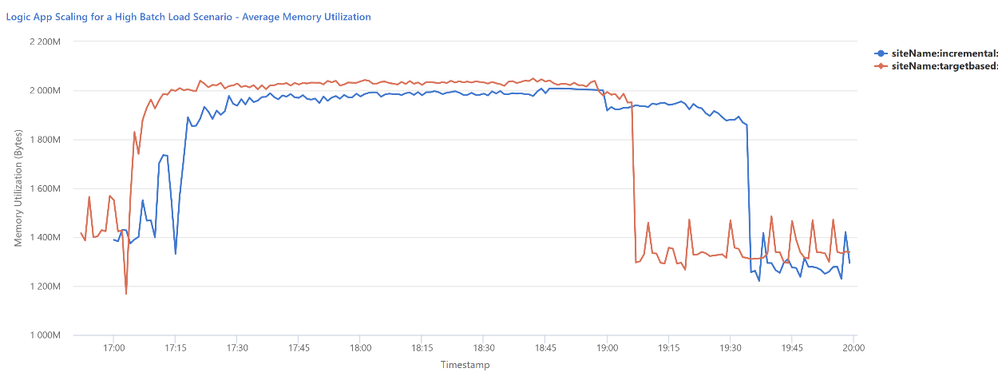
CPU and Memory Utilization
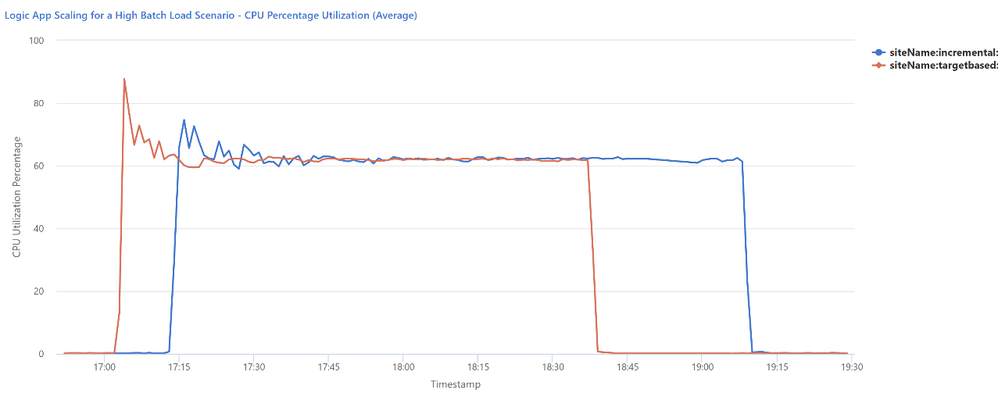
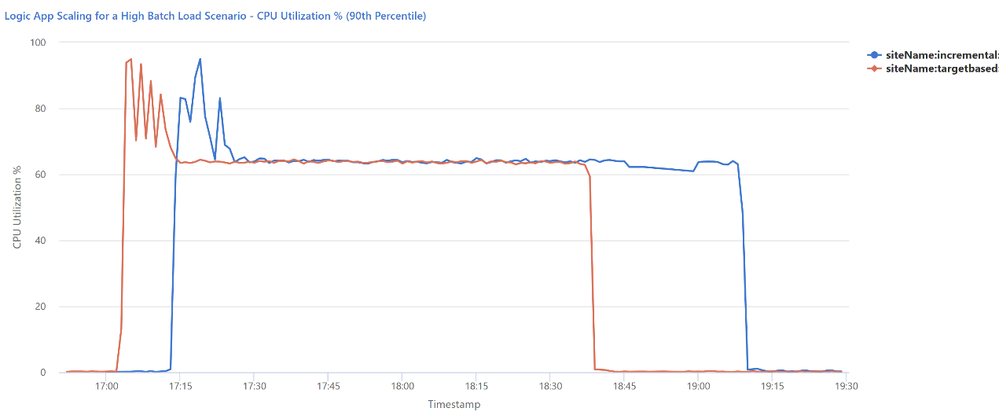
The diagrams below present the CPU and memory utilization for each instance added to support the workload. The default scaling configuration will try to keep CPU utilization between 60% and 90%, as under 60% would indicate that the instance is underutilized, and 90% would indicate that the instance is under stress, leading to performance degradation.
Average Percentage CPU Utilization Per Minute
90th Percentile CPU Percentage Utilization
The app with target-based scaling has a higher peak for CPU utilization initially, but it results in a faster ramp down of ~30 minutes compared to the app with incremental scaling.
Average Memory Utilization (in Bytes) Per Minute


