This post has been republished via RSS; it originally appeared at: New blog articles in Microsoft Community Hub.
Monitoring your database resources is critical to being able to detect issues or opportunities for improvements. When it comes to Azure Database for PostgreSQL Flexible Server, the monitoring story can be a bit overwhelming with multiple different services seeming to offer similar. There is often discussion between two services, Azure Monitor Metrics, and Azure Log Analytics . In this blog post, we are going to look at these two services and when you would use them. Let us start by looking at what these services do.
Azure Monitor metrics
Azure Monitor is a comprehensive solution for collecting, analyzing, and alerting time-series metrics from services like Azure Postgres Flexible Server. It helps to understand how service is performing and proactively identifies issues affecting them and the resources they depend on. For monitoring Azure Database PostgreSQL Flexible Server, we have over 60 metrics for monitoring various database aspect including resource utilization, database activity, replication, saturation, connections etc. Azure monitor is a provides powerful tools for the collection, visualization, and alerting the time series data. To learn more, refer Azure Monitor Metrics overview .
Azure Log Analytics (LA)
Azure Log Analytics is a service that monitors cloud resources and applications. It allows you to collect and analyze logs generated by resources in your cloud and on-premises environments. Azure Log Analytics is a service that provides advanced analytics capabilities and the aggregation of log data. Log analytics will collect and store your data from various log sources and allow you to query over them using a custom language called Kusto Query Language (KQL).
While Azure Monitor metrics focuses on time series data such as performance and resource usage metrics, Azure Log Analytics offers more complex querying and log data analysis. It is especially useful for long-term trend analysis and combining data from multiple sources to gain deeper insight into operations and performance across Azure services. To learn more, refer Overview of Log Analytics in Azure Monitor.
Combining Metrics with Log Analytics
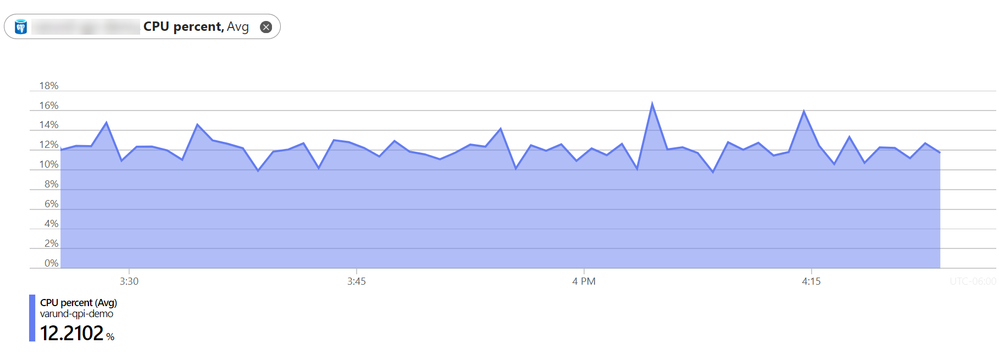
For single-instance monitoring and troubleshooting, Azure Monitor metrics is the go-to tool. Say, if you are having a slowness issue with a database server and you want to go and look at its CPU utilization, you can do this through Azure Monitor metrics using the portal and generate some great charts to learn what is happening now. Also, you can pin this chart to the Azure dashboard and Use the Azure portal to set up alerts on metrics for a specific resource. When debugging a specific issue on a small number of instances Azure monitor is great and will do exactly what is needed.
For complex monitoring tasks across numerous Azure PostgreSQL instances, Azure Log Analytics offers extensive data monitoring capabilities. This becomes invaluable when managing large server fleets, such as analyzing memory usage across 100 servers. With Log Analytics, data from all servers can be consolidated into a single log analytics workspace. This enables comprehensive visualization and alerting using the Kusto Query Language (KQL), simplifying what would otherwise be a daunting task of individually analyzing each server. This approach highlights Log Analytics' strength in handling large-scale, detailed data analysis scenarios.
As with Azure Monitor, we can pin these LA charts to Azure Dashboard. You can also configure alerts, but again we now only need one alert for multiple resources, and it will trigger when one or more breaches the threshold, rather than requiring an alert per resource. By sending Azure monitor metrics to Log Analytics you also gain more functionality:
- Monitoring at scale - Consolidate log entries from multiple Azure subscriptions and tenants.
- Long-term analysis - Log analytics offers retention for up to 2 years.
- Metrics correlation – We can query multiple different metrics and display them together to look for correlation.
- Complex queries – Log analytics leverages Kusto query language which can be used to undertake complex queries over large data series.
- Query other data – Azure monitor is obviously focused on timeseries metrics, versus with Log Analytics you can collect any sort of log data, including custom logs.
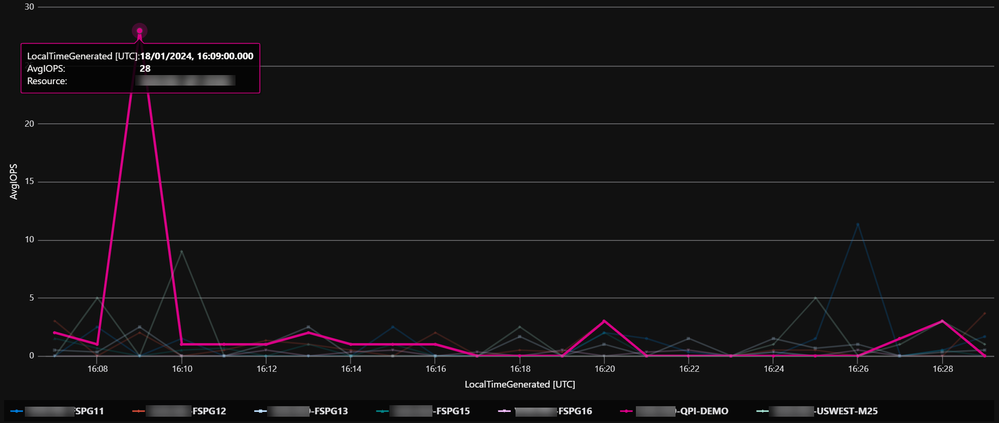
Combining Azure Monitor metrics and Azure Log Analytics offers a comprehensive monitoring solution. Azure Monitor provides real-time insights for individual instances, while Log Analytics offers depth for multiple instances. Azure monitor metrics data is stored in AzureMetrics table that holds metrics for all Azure resources. Once the metrics are enabled in the diagnostic settings for a resource, information is stored in this table. In the example below, I am using the below Kusto query on AzureMetrics table to visualize cpu_percent across a fleet of Azure Postgres Flexible Server Instances.
Create a Log Query Alert for Monitoring CPU metrics
Metrics data in a Log Analytics workspace is stored in a table called AzureMetrics that you can retrieve with a log query in Log Analytics. The structure of this table varies depending on the category of the log entry. For a description of the table properties, see the AzureMetric data reference. For a complete lists of metrics available for Azure Postgres, refer Supported Metrics.
For example, to view a count of metrics log records for each resource, use the following Kusto query.
To retrieve all metrics in the specific Azure Postgres Resource
To set up a log query alert for monitoring CPU usage across fleet of Azure PostgreSQL servers, you start by selecting a prebuilt log query or creating one using Kusto Query Language (like one above). This query should leverage cpu_percent metrics from your Azure resources.
Sample Kusto Query
Output
After verifying the query's results, proceed to create an alert rule in the Azure portal. Key steps involve:
- Configuring the condition based on the log query results.
- Setting alert logic with appropriate thresholds for CPU usage (e.g., alert if CPU usage is greater than 60%).
- Choosing an action group for notifications (email, SMS, etc.).
- Finalizing alert details like name, description, and severity.
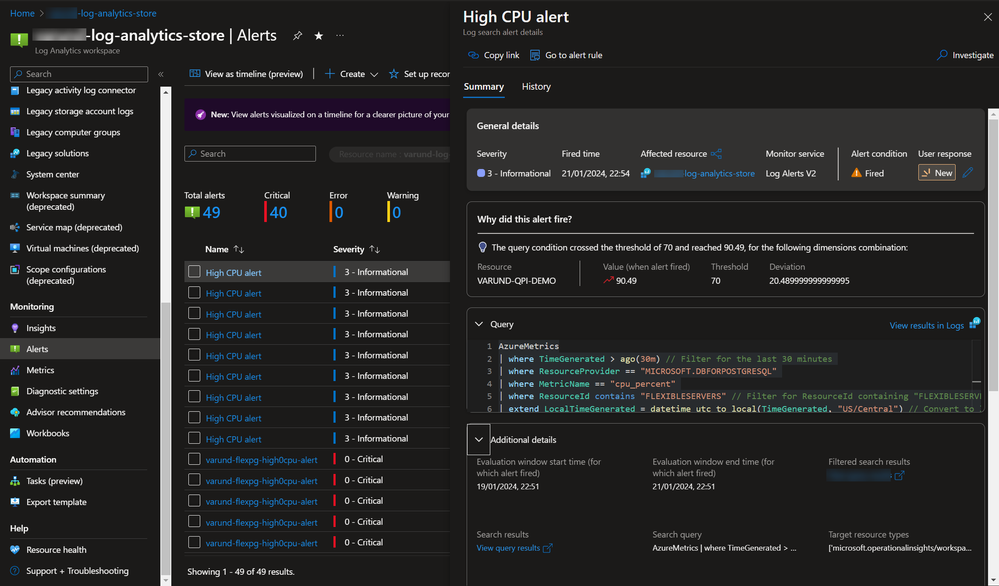
- When an alert fires, it sends notifications in its action groups. You can also view the alert in the Azure portal.
For detailed steps, refer to the Tutorial: Create a log query alert for an Azure resource.
Some things to consider when using Log Analytics
While Log Analytics offers comprehensive data analysis, it is important to note some key considerations:
- Data Ingestion and Alert Delay: The average latency to ingest log data is between 1 minute and 5 minutes. The specific latency for any data will vary depending on several factors that can cause delays in alert triggering compared to Azure Monitor's near real-time alerts. For details, refer Log data ingestion time.
- Additional Costs: Azure Log analytics cost is based on two plans: Basic Logs, currently free for search but with future billing to be announced, and Analytic Logs, offering Pay-As-You-Go (first 5 GB/month free) and Commitment Tiers (discounted rates starting at 100 GB/day with a 31-day commitment period, with overage billed at the tier rate). For details, refer Azure monitor logs pricing.
Log Analytics data ingestion strategies
So hopefully now it is clear that Azure Monitor is the service to aggregate the time series metrics from the Azure resources, and Log Analytics is the service to aggregate logs, and can be used if you want to monitor multiple Azure Postgres resources. Given this, the question is How do we get that data into Log Analytics. Fortunately, Azure Monitor comes with options for exporting metrics data. For PostgreSQL Flexible Server you have the ability to export logs data to following logging destinations:
- A storage account.
- An Event Hub.
- A Log Analytics Workspace.
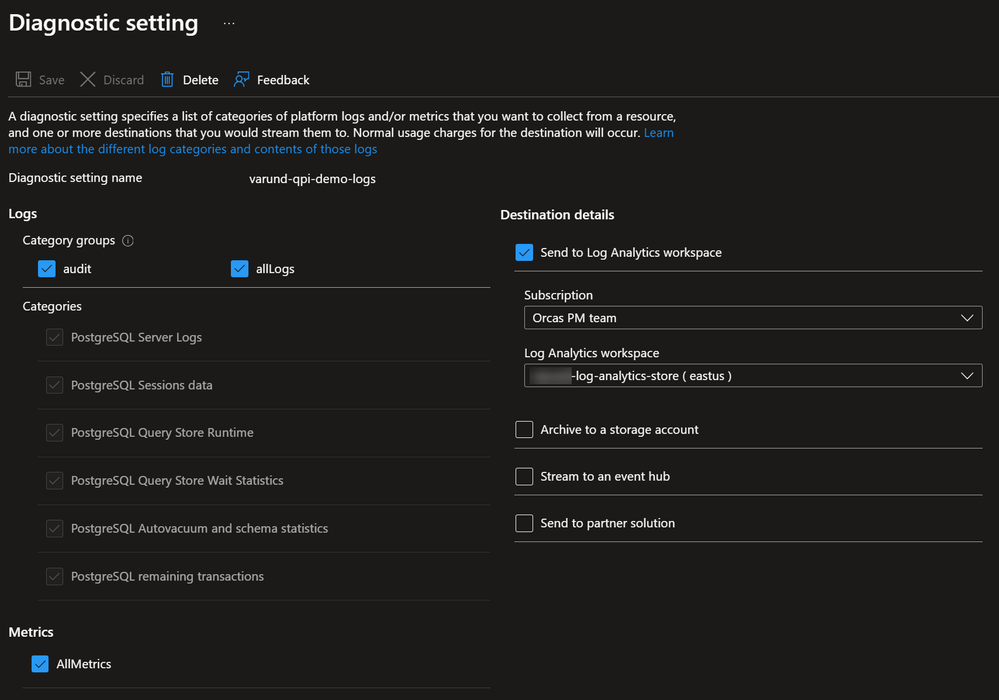
This can be configured through the portal, underneath the diagnostic settings tab for the resource you want to configure. In here you configure which of the 3 destination you want to send the data too and then what data you want to send. This will usually include options for both Logs and Metrics, and often the metrics option will just be “All metrics” which as the name suggests, sends all metrics that are available for that service. Below are the options for Azure database for PostgreSQL Flexible Server.
It is important to note that a single Log Analytics workspace can monitor resources across multiple subscriptions as long as they are under the same Tenant. For example, if you have an Azure PostgreSQL database in Subscription A and Log Analytics Workspace in Subscription B, you can send the logs and metrics from that PostgreSQL database to the Log Analytics workspace.
Conclusion
For large enterprises, the combination of Azure Monitor and Log Analytics forms a robust solution for monitoring Azure Database for PostgreSQL Flexible Server ‘at scale.’ This integrated approach is critical for monitoring a vast array of Azure resources through a single pane of glass, ensuring not just immediate issue resolution but also facilitating long-term, strategic oversight across the entire enterprise infrastructure. This strategy enhances both performance and reliability, aligning with the needs of large-scale, complex deployments.


