This post has been republished via RSS; it originally appeared at: Microsoft Tech Community - Latest Blogs - .
Introduction
Performance testing is not always a walk in the park. Quite often, it can be challenging and time-consuming, especially when dealing with complex and dynamic web applications that rely on JavaScript, AJAX, or other browser-side technologies.
For testing browser latencies under heavy load, JMeter has a built-in component called Web Driver Sampler, which allows testers to use Selenium WebDriver to simulate real browser actions and interactions with web elements. Web Driver Sampler can complement the HTTP Request Sampler, which sends HTTP requests to the server, by adding the browser-side perspective and measuring the rendering time, page load time, and user actions. By running JMeter scripts on Azure Load Testing, you can reliably execute your performance tests without worrying about resources and scalability.
In this blog post, we will show you how to use Web Driver Sampler in JMeter for performance testing, upload your scripts on Azure Load Testing and analyse your performance metrics on the browser-side on Azure Load Testing.
We will use a sample web application called the Podcast App which is a demo site for searching and listening to podcasts.
Step 1: Create a JMeter script for generating backend load
The first step is to create a script in JMeter that mimics a user situation on the Podcast web application that puts its backend under high load.
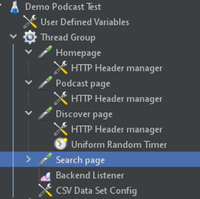
For this example, we will create a script that performs requests for the homepage, searches for podcasts, and enlists relevant podcasts using the below samplers –
Step 2 – Create a Web Driver Sampler in the JMeter Script
To create a Web Driver Sampler script in JMeter, you need to follow these steps:
- Download and install the JMeter Plugins Manager.
- Navigate Plugins Manager, navigate to “Options” from JMeter IDE and click on Plugins Manager. Now click on the Available tab of Plugin Manager and type Selenium/Webdriver Support. And select Selenium/Webdriver Support, click on Apply changes and restart JMeter.
- Add a new Thread Group to the above test plan and configure the number of threads, ramp-up time, and loop count according to your test scenario.
- Add a Config Element > jp@gc - Chrome Driver Config to the Thread Group. This will configure the Chrome browser as the WebDriver for the Web Driver Sampler. You can also choose other browsers, such as Firefox, Edge, or Safari, by adding the corresponding driver config elements.
- Add a Sampler > jp@gc - Web Driver Sampler to the Thread Group. This will allow you to write your Selenium WebDriver code in the Web Driver Sampler.
You can write your code in any supported language, such as Java, Groovy, JavaScript, or Python. For this example, we will use Groovy as the language.
- Write your Selenium WebDriver code in the Script area of the Web Driver Sampler as shown below –
Step 3: Upload and run your JMeter script on Azure Load Testing
The next step is to upload your JMeter script on Azure Load Testing and run your load test. You can create a new load testing resource or use an existing one to create a test. To create a load test, you can refer to the documentation here.
Step 4: Analyse browser-side performance
After the load test is completed, you can view your results in the Results dashboard. The dashboard depicts graphs of client-side metrics corresponding to each sampler.
The browser-side performance of the application can be analysed by viewing the trends and aggregations in client-side metrics of the WebDriver Sampler. This can be seen in the graphs generated as shown below -
The response time of WebDriver Sampler represents the time it took for the browser to load when the backend of the application is under heavy load. Likewise, the requests/sec measures the throughput when the web application is tested with simulated browser actions.
One way to check if the browser loaded properly is to configure the elements in your selenium script that you want to verify. For example, you can use the findElement method to locate an element by its ID, name, class, or XPath, and then use the isDisplayed method to check if the element is visible on the page. By adding these checks in your selenium script, you can ensure that the browser rendered the web page correctly.
Conclusion
If you are new to Azure Load Testing, you can follow these instructions to set up your tests. Existing users can add the web-driver sampler in their scripts on Azure Load Testing.
We hope that this guide will help you to create realistic and robust performance tests for your web applications.


