
This post has been republished via RSS; it originally appeared at: Microsoft Edge Blog.
If you're debugging JavaScript in Visual Studio Code you probably have used either the Chrome Debugger or the Microsoft Edge Debugger extension. Neither are necessary any longer to debug as JavaScript debugging is now built-in to Visual Studio Code. This does not only mean that you can uninstall these extensions, but we also made debugging more convenient. To debug any project in either Chrome or Microsoft Edge, all you need to do is to start a session by pressing F5 or activating the debug icon in the menu bar and selecting "Run and debug". Alternatively, you can also use the Visual Studio Code command palette and run the “Debug: Open Link” command. From there on you can choose to debug in Chrome, Edge or Node.js without having to install any extensions.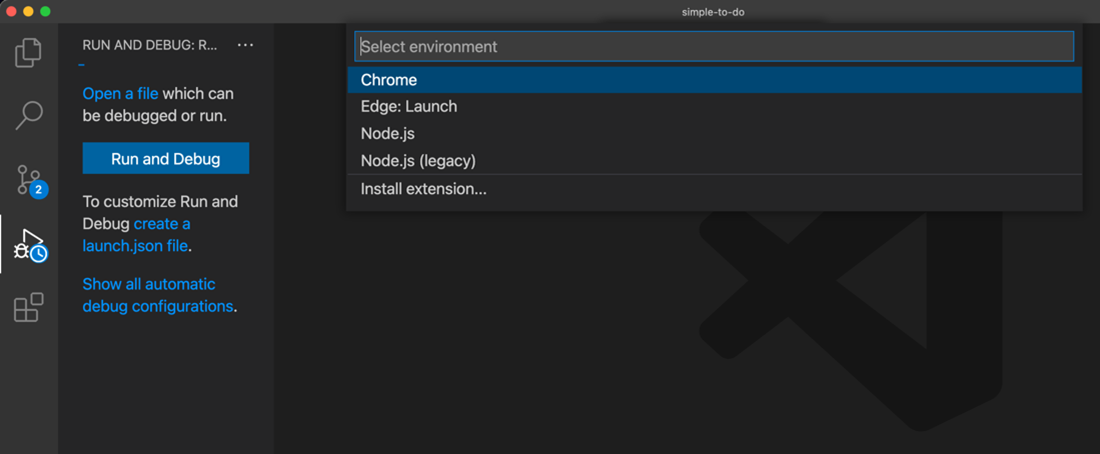 If you choose Edge, you'll notice an extra feature in the debug toolbar: an inspect button.
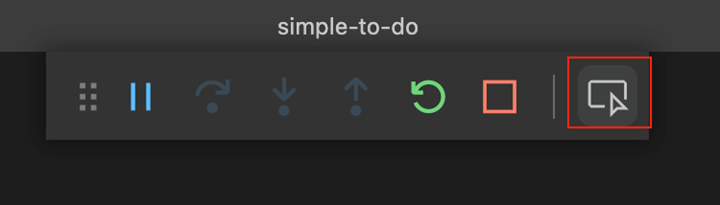
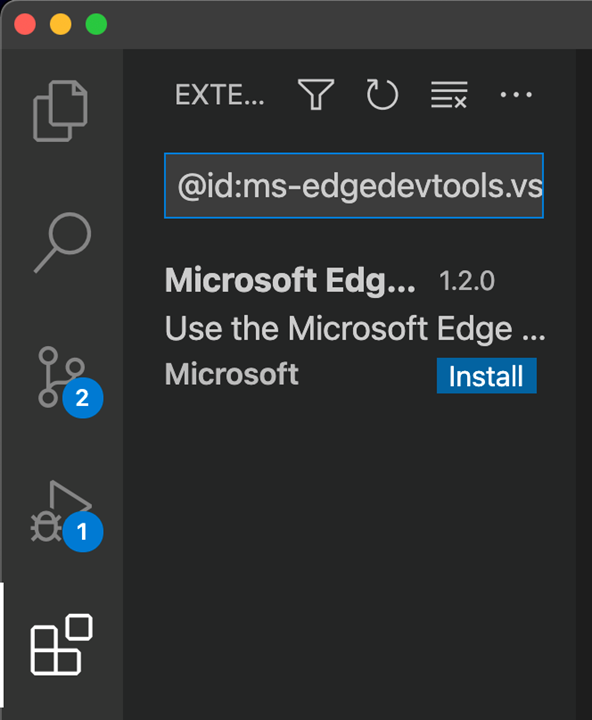
 This button launches the Edge Developer Tools right inside your Visual Studio Code instance. The first time you activate this button, the editor will ask you to install the Microsoft Edge DevTools for Visual Studio Code extension. Once you have this one installed you won't be prompted again.
 You can then inspect the DOM, change CSS, and see network requests of your project running in the browser without leaving Visual Studio Code.
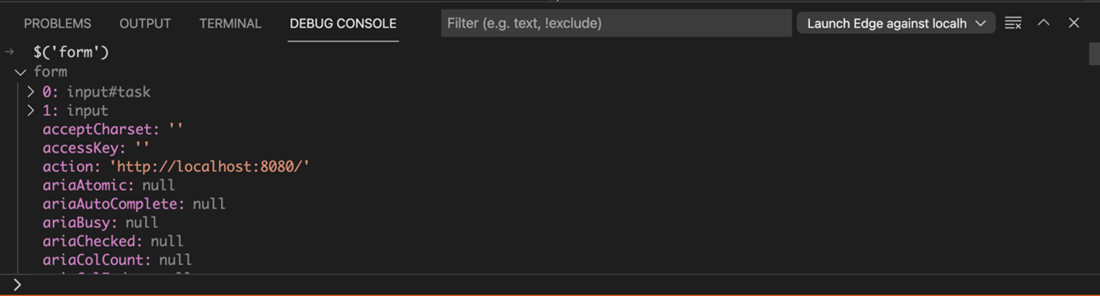
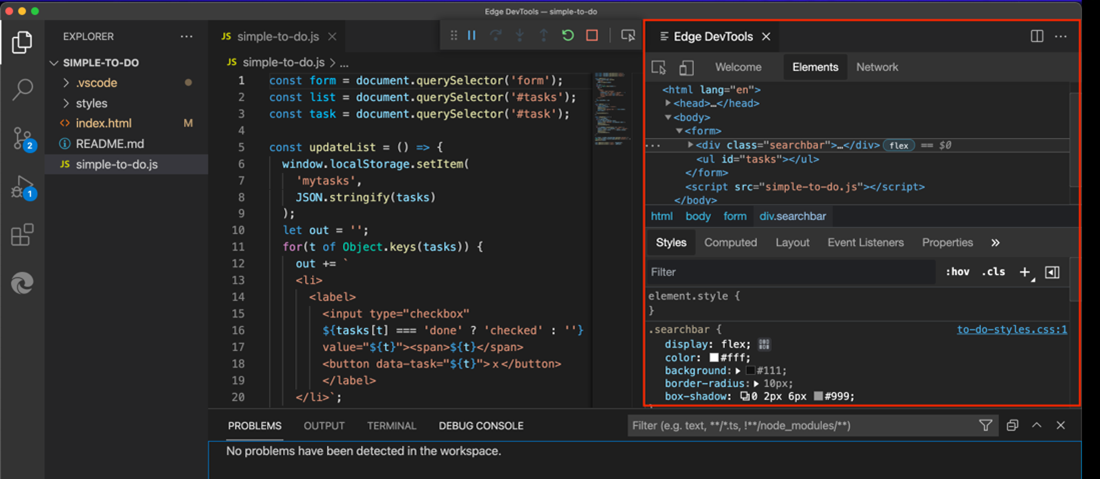 As a bonus, you can also use the Debug Console in the editor to interact with the document in the browser, much like you would with the Console in the browser developer tools. You have full access to the window object and can use the Console Utilities API.
 If you want to automatically attach to Microsoft Edge and launch the Developer Tools in the editor, you can create a launch.json file. Notice that `https://localhost:8080` probably needs to be changed for your project.
{
  "version": "0.2.0",
  "configurations": [
    {
      "type": "vscode-edge-devtools.debug",
      "request": "launch",
      "name": "Launch Microsoft Edge and open the Edge DevTools",
      "url": "http://localhost:8080",
      "webRoot": "${workspaceFolder}"
    }
  ]
}
If you want to take a deep-dive into the features of the built-in JavaScript debugging workflow of Visual Studio Code, you can check the README file of the debugger extension.
We hope that by automatically including the option to debug with browsers into Visual Studio Code we made the process easier to get started and would love to learn what else we can do to make you more effective in your debugging journey. Send feedback (Alt-Shift-I with the DevTools open) or reach out to the team on Twitter to let us know what you think!