Monitoring CPU usage on your SQL Server or Azure SQL is one of the most important monitoring tasks in performance monitoring and troubleshooting. In addition, CPU usage is one of the most important parameters that you need to measure to determine the performance baseline of your workload. In this article you will see some of the common tools and methods for monitoring CPU usage on SQL Server and Azure SQL.
SQL Server Management Studio
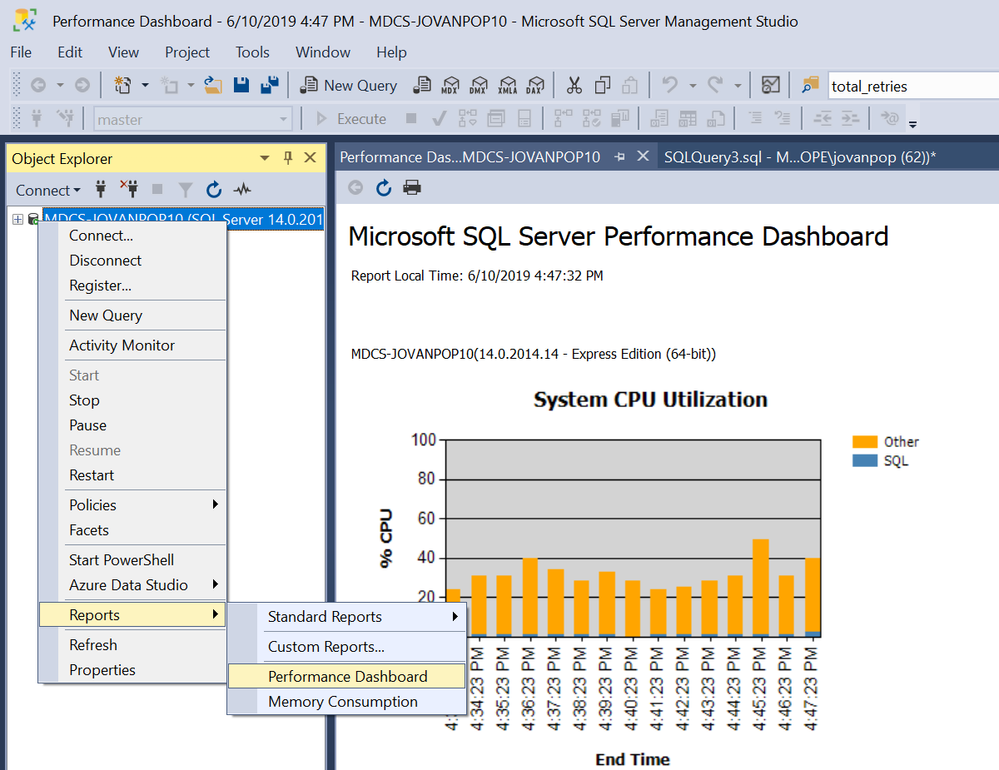
SQL Server Management Studio provides easy to use reports where you can monitor usage of various system parameters. Performance Dashboard is one of the useful reports that you can use to monitor CPU usage:
Once you connect to your SQL Server or Azure SQL instance, you can select Reports > Performance Dashboard and see the current and historical values of CPU usage.
In addition, you can find top CPU consumers by selecting another report – Reports > Standard Reports > Performance – Top Queries by Average CPU time.
If you are using Azure SQL or SQL Server 2016+, you can find the queries that used most of the CPU in Database > Query Store > Top Resource Consuming Queries.
Dynamic Management views
SQL Server Database Engine provides a set of useful system views that you can use to find CPU usage. As an example, you can use sys.dm_os_ring_buffers view to find CPU usage:
SELECT

         cpu_idle = record.value(‘(./Record/SchedulerMonitorEvent/SystemHealth/SystemIdle)[1]’, ‘int’),

         cpu_sql = record.value(‘(./Record/SchedulerMonitorEvent/SystemHealth/ProcessUtilization)[1]’, ‘int’)

FROM (

         SELECT TOP 1 CONVERT(XML, record) AS record

         FROM sys.dm_os_ring_buffers

         WHERE ring_buffer_type = N’RING_BUFFER_SCHEDULER_MONITOR’

         AND record LIKE ‘% %’

		 ORDER BY TIMESTAMP DESC

) as cpu_usage
If you are using Azure SQL Managed Instance, you can use sys.server_resource_starts view:
select top 200

    start_time,

    [cpu usage %] = avg_cpu_percent

from sys.server_resource_stats

order by start_time desc
This view can also return historical information about the CPU usage on your instance. In Azure SQL single database you can use equivalent sys.resource_stats
Performance Monitor (SQL Server-only)
Perf Mon is one useful tool that you can use to track CPU usage on the server or virtual machine where your SQL Server is running. Some of the parameters that you can monitor are:
– Processor: % Privileged Time
– Processor: %User Time
– System: Processor Queue Length
Azure Portal (Azure SQL-only)
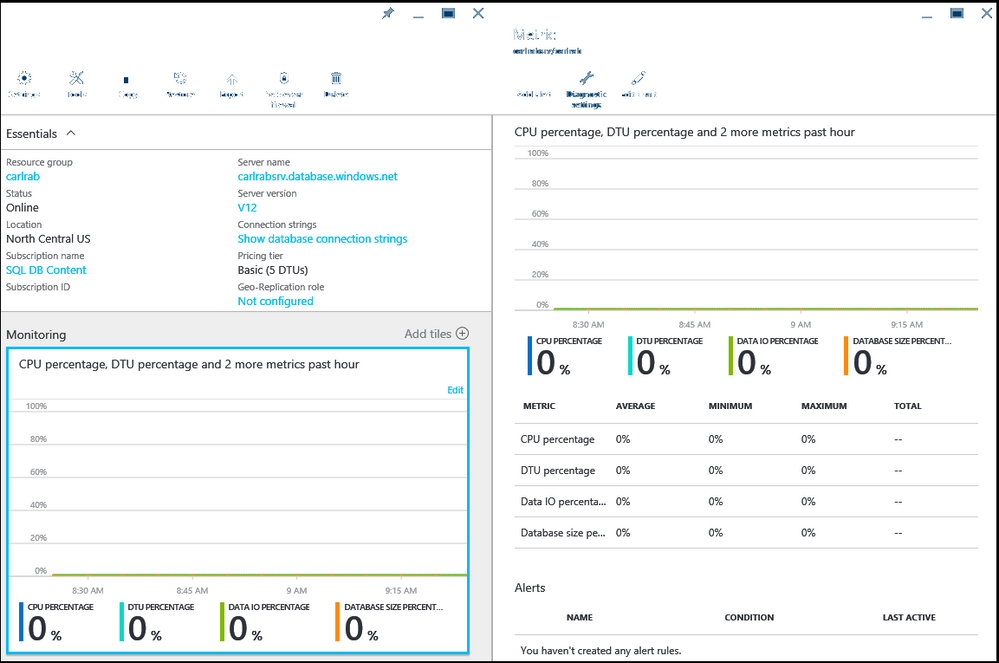
The Azure portal enables you to monitor performance with easy-to-use interface. If you navigate to your Managed Instance or Single Database in the Azure portal you can see CPU usage on the main blade:
Custom tools
There are many third-party tools or community scripts (that use T-SQL or PowerShell) that enable you to monitor performance of your database. Most of them use CPU utilization as one of the fundamental metrics. As an example, you can use Get-DbaCpuUsage command from PsDba tools PowerShell library to monitor CPU usage using the following PowerShell:
Get-DbaCpuUsage -SqlInstance sql2017


