This post has been republished via RSS; it originally appeared at: Azure Database Support Blog articles.
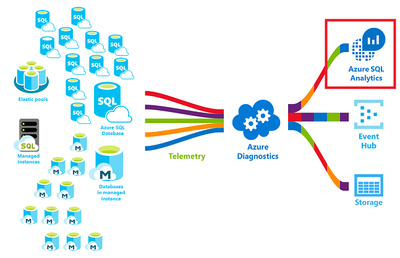
As a DBA you may want to query SQL Audit and SQL Diagnostics information. The easiest way to do this is sending to Log analytics that is part of Azure Monitor
You can also send this data to Event Hubs and storage accounts. On this post I will focus on Log Analytics
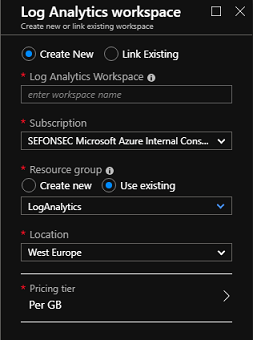
1 – FIRST CREATE AN LOG ANALYTICS WORKSPACE
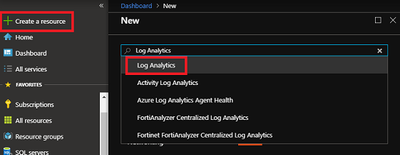
Click on Create a Resource and search for Log Analytics
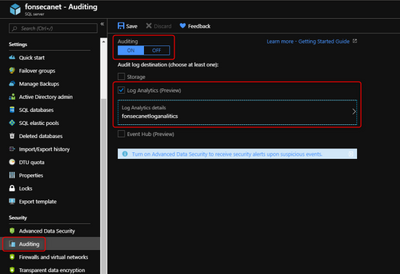
2 – ENABLE AUDIT TO LOG ANALYTICS
At Server level or at Database level, enable auditing and send log to Log Analytics and select the workspace you just created
3 – ENABLE DIAGNOSTICS TO LOG ANALYTICS
*This configuration is done PER DATABASE
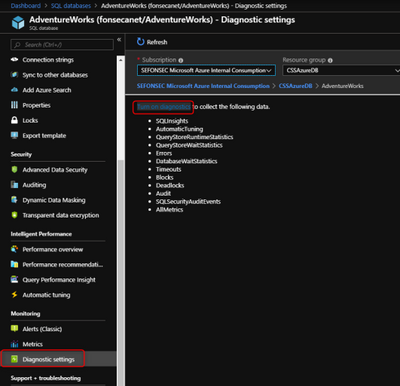
Click on Diagnostics Settings and then Turn On Diagnostics
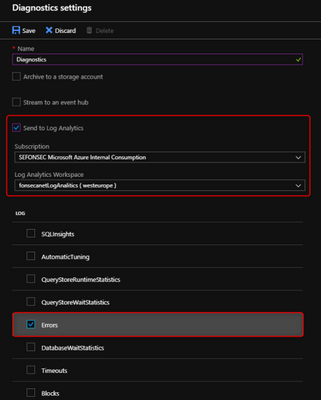
Select to Send to Log Analytics and select the Log Analytics workspace. For this sample I will selected only Errors
4 – QUERING LOG ANALYTICS
Just go to the Log Analytics workspace and query the database using a language called Kusto. More information and sample on sintax can be found on this link
A Kusto query is a read-only request to process data and return results. The request is stated in plain text, using a data-flow model designed to make the syntax easy to read, author, and automate. The query uses schema entities that are organized in a hierarchy similar to SQL’s: databases, tables, and columns.
The data we will work in this sample can be found on table AzureDiagnostics
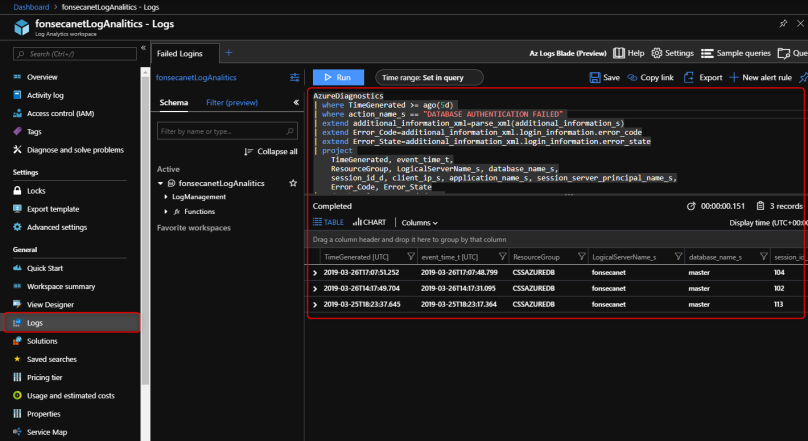
Just write a query and click Run
4.1 FAILED LOGINS SAMPLE
For this sample use query below to find failed logins
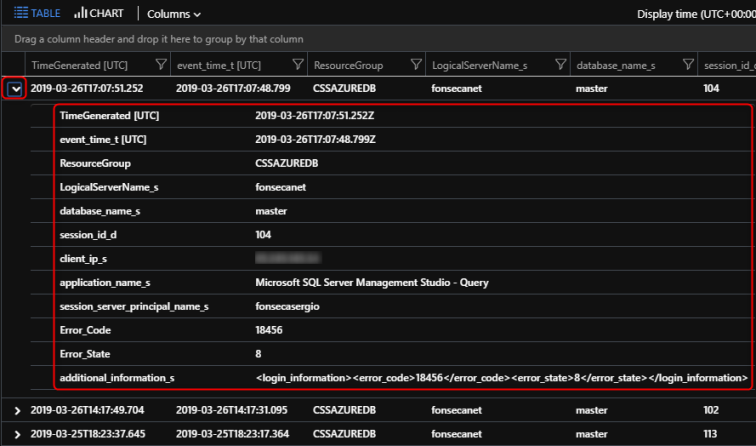
Expanding this event we can see all information from this event
- Date/Time
- Server
- DB
- Application Name
- User
- IP
- Error Code and Error State
- etc
You can then use this Error Code and State to find what is the error description
In this case:
– Error 18456: Login failed for user ‘%.ls’.%.ls
– State 8: The password is incorrect
4.2 ERRORS GENERIC
Use the query below to find all errors or specific errors
You can find some information related to the errors. Can be useful to consolidate information, histogram, alerts, etc
*Notice that there is no information on who caused the error. Because this information came from Diagnostics information, not the audit
4.3 ERRORS DETAILED
With this other sample below you can get the queries that failed with full information on who did it, what query, etc.
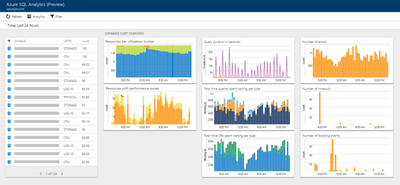
5 – YOU CAN ALSO MONITOR USING AZURE SQL ANALYTICS (PREVIEW)
https://docs.microsoft.com/en-us/azure/azure-monitor/insights/azure-sql
I will not speak about it on this article
There will be more articles on this topic Azure SQL DB + Log Analytics
More information can be found
- https://docs.microsoft.com/en-us/azure/sql-database/sql-database-metrics-diag-logging
- https://docs.microsoft.com/en-us/azure/sql-database/sql-database-auditing
- https://docs.microsoft.com/en-us/azure/azure-monitor/platform/manage-access#create-a-workspace
Republishing original post published at https://fonsecasergio.wordpress.com/2019/03/30/azure-sql-db-and-log-analytics-part-1/

