This post has been republished via RSS; it originally appeared at: Azure Data Explorer articles.
As Azure Data Explorer (ADX) recently celebrated its one-year GA anniversary on February 9th, and for the first year anniversary this is a good time to start a monthly newsletter highlighting the progress of the service. Since this is the first edition, it will cover the many new features that have been added over the last 12 months.
Over the last year we focused on (1) addressing enterprises compliance needs (2) cost reduction and performance (3) expanding the ingestion interfaces (4) creating deep Azure Data Lake integration (5) new language capabilities (6) enhancing the data science capabilities and (7) new tools capabilities and visualizations options.
Here are more details about the features in production, there are many more enhancements in progress so stay tuned for the next editions -:)
Enterprise and Security
Over the last year we worked with many companies to certify Azure Data Explorer for usage with their top secrete data, this required adding the following features:
- Network isolation via VNet Injection that allow running ADX clusters within the enterprise’s private network. This recently became a GA feature.
- Disk Encryption can now be configured for the clusters VMs.
- Customer managed encryption keys can be used to encrypt the cluster’s storage accounts.
- Row-level access and masking allows filtering and masking rows based on user identity.
- Zonal redundancy option was added for compute and storage to increase resiliency.
-
Fully managed auto-scale provides simple experience to set the cluster auto-scale fully managed by the Azure data explorer service
Cost reduction and performance
- New SKUs were added to provide the most optimal VM type for any scenario starting with a Dev/Test cluster at the cost of ~$200 per month.
- ADX RI (Reserved Instances) can now be purchased for one- or three-years commitments with up to 30% discount. Reserved instances can also be bought for the compute and storage used by the cluster to achieve overall discount of ~40% (depending on the cluster setup)
- Follower database provides a way to run different workloads on the same data using different clusters. See more in the Data lake integration section.
Data ingestion
- Data pipelines: new connectors offer easy integration of sources like the Azure IoT Hub or open source technologies such as Kafka and Logstash.
- Azure Data Factory provides multiple ADX connectors that allow to easily ingest and export from/to many data sources.
- Streaming Ingestion offers better efficiency in the “trickling data” scenario where many tables are ingested with relatively small data size for each table. In addition, streaming ingestion can reduce the ingestion latency to less than a couple of seconds.
- New data formats were added such as Avro, ORC and Parquet, either uncompressed, in ZIP or GZIP compression. The ADX community also added an Apache Samza Avro export to Azure blob storage which makes it easy to complete the pipeline by setting up an Event Grid data connection to ADX.
Azure Data Lake integration
- External tables allows to easily query and export from/to the Data Lake. These are special Kusto tables where the data is stored in the Data Lake or in SQL databases and not in the cluster itself.
- Continuous data export allows exporting the cluster’s data in a regular interval ensuring that data will not be duplicated to the Data Lake using multiple formats such as parquet, json, and csv.
- Kusto Spark connector was added to support modern data science and engineering workflows. This connector simplifies integration with Spark products such as Azure Databricks, HD Insight, and other Spark distributions.
- Follower databases and Azure Data Share integration allows for using new or existing ADX clusters to query data already in a different (leader) ADX cluster. This enable running different workloads on their own dedicated hardware in order to tune performance, create security isolation and easily assign cost to the department who uses the data.
New Kusto language capabilities
The Kusto query language usage is expanding rapidly and is now exposed in different products and services including Azure Log analytics and Application Insights, Windows advanced threat protection, Episerver, Squaredup, and Azure PlayFab. Over the last year we added many new functions and operators and made it open source in order to accelerate its adoption. Here is the detailed list:
- Kusto Query Language is now open source, the repo contains the specifications and the language parser and semantic tree. This is in addition to the query editor that is already available on GitHub. The goal is to allow the community to integrate the Kusto language into existing experiences for example advanced hunting in Windows advanced threat protection or by other database vendors who would like to adopt the Kusto Query language for their products.
- Geospatial functions provide efficient Geo searches such as geo_point_to_geohash(), geo_distance_2points() and geo_point_in_polygon()
- New string operators makes matching on set of values easier includes now (1) case insensitive ‘in~’ (2) ‘has_any’ which provide succinct syntax to perform multiple term searches in a text column
- User identity functions current_principal(), current_principal_details() and current_principal_is_member_of() are useful when implementing row level security.
- New aggregation functions: simplify the scenario of evaluating a predicate in order to determine if a value should be part of the aggregation we added a set of conditional aggregations such as anyif(), make_set_if() and others. In addition we added the make_bag() function that creates a json property bag from a series of json values.
- New scalar functions that simplify common tasks (1) searching an element in an array or set (array_index_of() , set_has_element()) (2) Array functions such as element-wise iif function array_iif() that can be used in conjunction with other series functions such series_less(), array shifting and array rotating such as array_shift_left() and array_rotate_left() (3) a new set of parse functions that allows parsing different formats such as parse_user_agent(), parse_ipv4(), parse_url(), parse_path(), parse_version() and others (4) Unix time conversions to Kusto datetime type such as unixtime_microseconds_todatetime() (5) Formatting functions that allows to easily output different types as strings such as format_bytes() that formats bytes to the applicable data size convention , format_datetime() and format_timespan() (6) Utility functions such as hash_combine() that allows combining multiple hash values, row_window_session() that calculates the session’s start value and new_guid() to generate a new guid.
- New plugins that extend the built in operators (1) diffpatterns_text() finds a text pattern that categorize a difference between two sets of strings in the same column (2) sequence_detect plugin detects occurrences of sequence of events (3) infer_storage_schema() infers schema of external data, and returns it as table schema string that can be used when creating external tables.
- New operators add to the expressiveness of the Kusto Query Language and thus allow to accomplish more with less code. The new operators allow to (1) process sub tables stored in a record such as ‘arrays’ in the scope of the table using the mv-apply operator (2) extend a fact table with additional columns from the dimension table using the lookup operator(3) parse and filter the results set to the records where the parsed columns exist using the parse-where operator (4) easily specify the desired output schema with project-reorder and project-rename
Data science
- Python and R plugins offers the ability to run python and R code within the query execution. This inline execution of code in the context of the query allows for highly customized queries using ML models and usage of the most popular R and Python package directly on tables, offering highly efficient data processing. Check out this GitHub repo for examples.
- Python debugging in VSCode provides an integrated, end-to-end development and debugging experience of python and R code within Visual Studio code.
- New time-series functions: series_pearson_correlation() Calculates the Pearson correlation coefficient of two numeric series inputs.
Tools and Visualization
Dashboards and external tools
- Many dashboards now have native connectors to ADX including Power BI, Grafana, Tableau, Sisense or Redash.
- K2Bridge project adds the ability to use Elasticsearch’s Kibana with ADX backend, this is ideal for transitioning existing ELK deployment to ADX. In addition, the Logstash Kusto plugin allow to easily route the data collected by Logstash to ADX.
Kusto Web Explorer
Kusto web explorer is the web tool for ADX interactive query experience shares many experiences including the intellisense, colorizing, sharing queries and results, dark and light themes with Kusto Explorer, here are a few selected improvements:
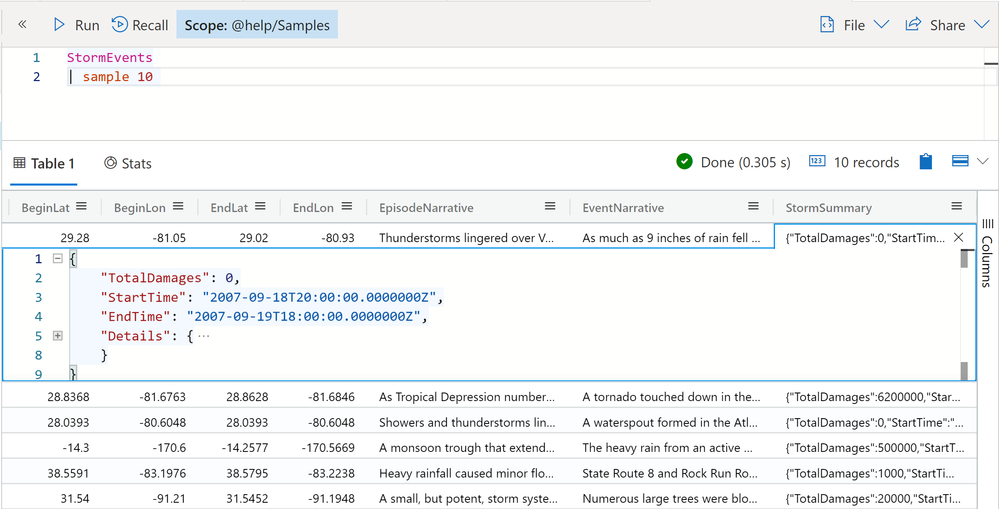
- Inline JSON viewer that makes it easy to view and navigate JSON and long text data:
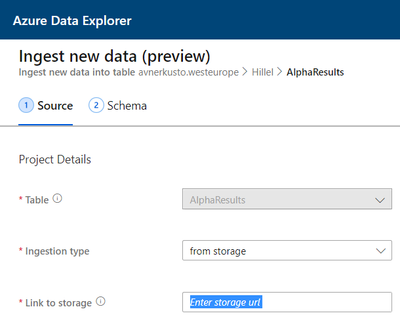
- OneClick Ingestion is a unique experience to Kusto Web explorer that provide a curated experience to ingest data from files including auto creation of tables and ingestion mappings:
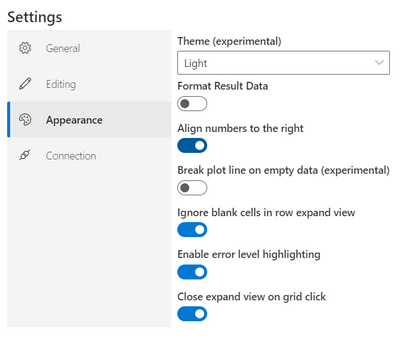
- Format numbers option allows turning off number formatting, this is useful when the number represents identifiers. This and other useful options can be found in the settings->appearance section:
Kusto Explorer (Windows)
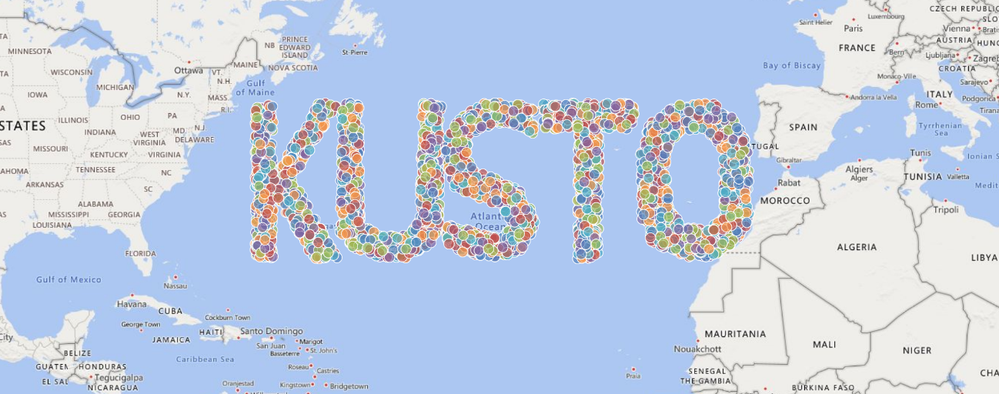
- Geospatial visualizations can be used with some of the chart types by adding the “kind=map” to the chart properties, here is an example:
- IntelliSense has been greatly improved. It is much more powerful and has better documentation. Also, pressing F1 in Kusto Explorer on a specific part of your query opens the applicable operator/function documentation.
- Exporting query results directly to local disk is now available using the “Run Query into CSV” button:
- Code refactoring and code navigation capabilities have been added including ‘rename’, ‘extract let statements’, ‘go to definition’ and ‘find all references’.
- Code Analyzer evaluates the current query and outputs a set of applicable improvement recommendations:
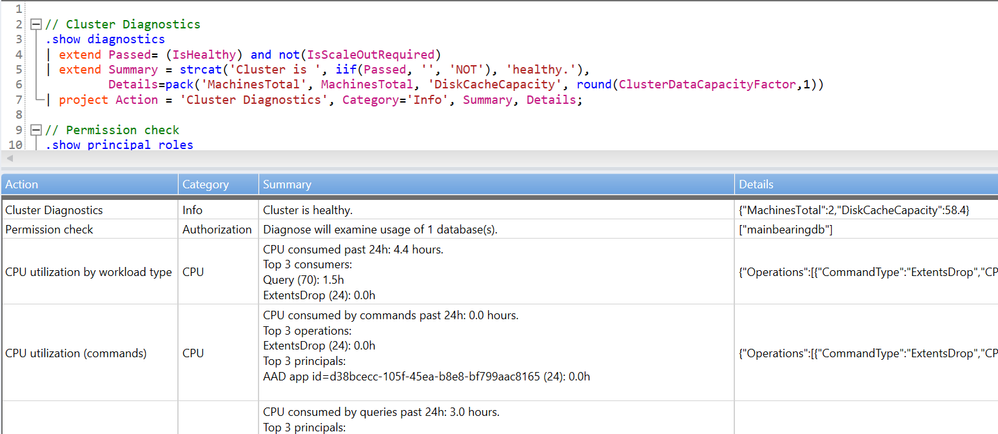
- Analyze cluster health pre-defined queries are available via right-click on the cluster name in the connection pane or by pressing Ctrl+Shift+F1.
- A new card view has been added to better visualize individual rows of a result set. Right click on a row in the result set and select “Show record details” or press Ctrl+F10.

