This post has been republished via RSS; it originally appeared at: New blog articles in Microsoft Tech Community.
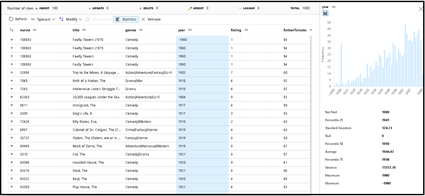
ADF Data Flows provides an interactive data profiler experience.
This blog post explains how to save those stats to storage. Here is a link to an ADF pipeline template to install this summary stats data flow as part of your factory. Download the pipeline template and load it into your ADF factory by going to New / pipeline from template / use local template.
This video walks through this technique:
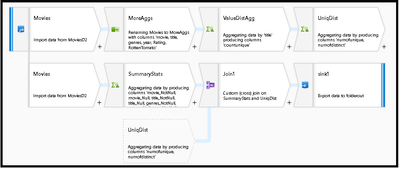
1. From your Data Flow source, add a new branch. We'll branch off 2 different sets of aggregates. ADF Aggregrates will reduce the columns and rows in your data, so branching allows you to copy the data and work with different streams of aggregates.
2. The bottom SummaryStats aggregate is where you will build the primary set of aggregations that you wish to store. Do not use any grouping so that ADF can build the aggregates across your entire dataset.
We'll use the Column Pattern option in Aggregate which allows you to build rules that simplify computing values across many columns and rows. This Aggregate has separate rules for all columns using true(), all numeric columns, and all string columns. The $$ special syntax represents each matched column name and each matched column value.
3. The left-hand side above is building new column names for each aggregate type and performing the aggregate calculation on the right-hand side. The data preview results should look something like this:
4. The top row aggregates will produce unique and distinct value counts for individual string / text / categorical data. In this example, I used the field "Title". So the ValueDist aggregate uses Title as the group by field. The expression is simply count() so that we'll get a count of all values that are grouped together, essentially giving us only unique rows.
5. In the UniqDist aggregate, we can now calculate the unique and distinct value counts for that column. Set no group by and use these formulas:
Distinct is the number of distinct values in that string column, while unique is the number of times that value occurs only once in that string column.
6. I join the 2 separate sets of aggregates together with a Cross Join and then output the results to a CSV file in blob. You'll end up with a CSV output of your summary stats like this:


