This post has been republished via RSS; it originally appeared at: Core Infrastructure and Security Blog articles.
Hi Team, it's Eric Jansen again, here today to continue where we left off in Part 3 of the series. In the last episode, we discussed how to parse the DNS Analytical Log using a sample scenario where I've deployed a DNS Black Hole Solution, and my goal was to harvest specific data of interest. Today we are going to take the data that we previously collected and report our findings. I wanted to talk about this because I've seen a number of customers employ DNS block lists as a security measure, but they don't look to see what's getting blocked, which I find somewhat shocking. If you don’t check to see what's actually being blocked, other than the occasional end user complaining that they can’t get to something, how would you know if the block list is providing any value at all?
There are many ways to report the data of interest but today I'm going to show a simple means to do some basic reporting, writing just the data that you care about, to its own event log. We'll take the millions of events that we parsed through in the last part of this series and simply report the findings in just a handful of 'higher level' (arguably more useful) events, while still giving you the ability to find any of the more specific data that you're interested in.
Note: For the ease of discussion, I'm taking small snips of code from a much larger function that I've written (where additional events are parsed) and showing just the necessary info in the code blocks below for ease of discussion. In some cases, I'm changing the code from the function so that it makes more sense when seen independently. Towards the end of this series, I'll likely post all of the complete functions to a GitHub repository for folks to use.
And with that, here’s the usual disclaimer that all my code samples come with:
The code snippets above are considered sample scripts. Sample scripts are not supported under any Microsoft standard support program or service. The sample scripts are provided AS IS without warranty of any kind. Microsoft further disclaims all implied warranties including, without limitation, any implied warranties of merchantability or of fitness for a particular purpose. The entire risk arising out of the use or performance of the sample scripts and documentation remains with you. In no event shall Microsoft, its authors, or anyone else involved in the creation, production, or delivery of the scripts be liable for any damages whatsoever (including, without limitation, damages for loss of business profits, business interruption, loss of business information, or other pecuniary loss) arising out of the use of or inability to use the sample scripts or documentation, even if Microsoft has been advised of the possibility of such damages.
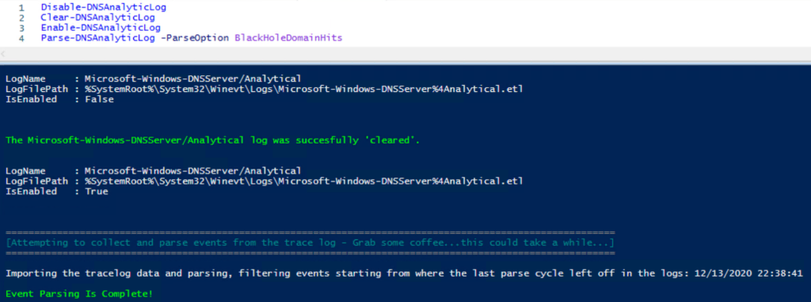
Ok, so in the last episode, we ran some snippets of code, which resulted in data being stored in a variable called $HitData. That variable contained query data that was blocked by the server as a result of DNS policy. The first thing that we're going to do is create a new event log to put this 'data of interest' into:
The snippet above creates a new Event log called DNS-Server-AnalyticLog-ParseData, defining two event sources, that we'll be using later on. Our mission now is to extract that data into even more 'boiled down' higher level info. To do that we're going to pick and choose the data that we want out of $HitData for building messages to write to our shiny new custom event log. Here's a sample of how we can get that done:
In the code above, you'll notice a non-native function called Get-CharacterCount, that can be found here:
I have notes in the code, but in summary, it further picks apart the data that's stored in the $HitData variable and stores it into separate variables for use in building possible messages that are dumped to the different events. For this scenario, I have four Events defined:
Event ID 0 - This event is triggered if a parsing cycle occurs and there are not hits, which is possible, but unlikely (depending on the block list used). This lists possible reasons for this event being triggered.
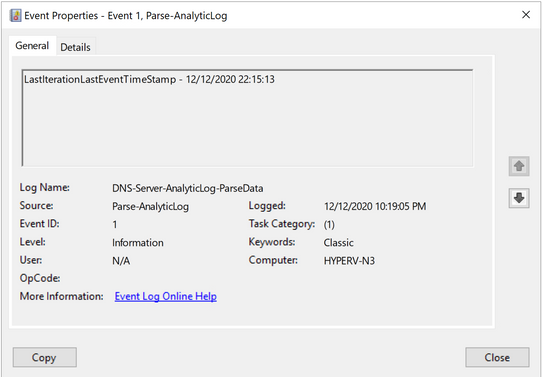
Event ID 1 - This event is triggered on every parsing cycle, but only if events are found in the $HitData variable. In this case it logs the timestamp of the last event that was parsed, during the last parsing iteration.
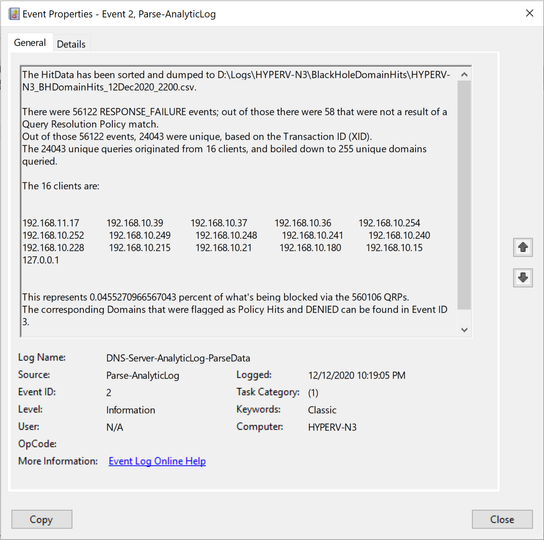
Event ID 2 - This event shows the "Bottom-Line Up-Front" information that can be customized to whatever you decide is of value.
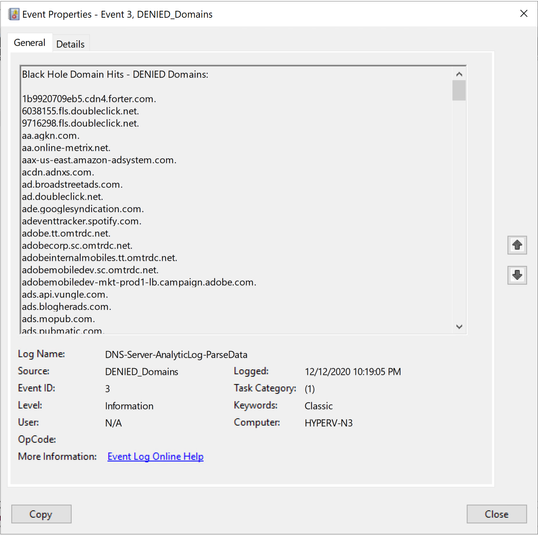
Event ID 3 - This event shows just the domains that were Denied from query attempts to the resolver. The list tends to be long, so I have it stored as its own event.
One thing to consider, in Part 3 of the series, I show how to build a hash table for use in filtering the log for just the 258 events, but you can add more filters to that to further reduce the amount of data that needs to get parsed. That's the reason that I've included Event ID 1 above - when employed, it tells the next parse attempt to start parsing events beginning when the last event that was parsed. This can save a considerable amount of time, depending on traffic and how long you go between parsing cycles, among other things. The snippet below shows how I collect the timestamp and how to use it in the $FilterHashTable variable - essentially, just adding to that which I previously showed:
The updated Hash Table would just include a new value - StartTime:
At this point, we've further parsed the collected data into subsets of information for building messages for writing to our custom event log, showing only the "Bottom-Line Up-Front" information that we're interested in. At the same time however, we're writing ALL hit data to a .csv file during each parsing cycle, so we still have the ability to further investigate any interesting information that we find in the new events that we're writing to. We have the best of both worlds! The .csv files (I say plural, because ideally this parser would be set up to run on a schedule) can further be leveraged by ingesting them into SQL or other data repositories for use in analyzing historical trends among other metrics. So let's take a look at what I have in my lab, to show you what the final product looks like in Event ID Order:
|
Event ID 0: |
Possible explanations of why there are no Query Resolution Policy hits. |
I didn't have any examples of this event, so I had to reproduce it artificially to be able to get a screenshot of it:
|
Event ID 1: |
Timestamp of the last event that was parsed during the last parsing cycle. |
|
Event ID 2: |
Bottom-Line Up-Front Data - This can be whatever you think is important. |
|
Event ID 3: |
List of domains that were blocked as a result of a Query Resolution Policy. |
Well, team...as you can see, we've managed to successfully parse the DNS Analytic Log, define some data of interest, and then built some report data that we've shipped to a custom created event log called DNS-Server-AnalyticLog-ParseData. It's not the prettiest solution, and there's plenty of room for innovation, but it's better than just putting a block list in place and not knowing if it's effective or not. Now you just need to remember to check the logs, like any other log that you deem important.
You know what would be super cool though?? What if instead of just shipping this data to an event log, what if we were able to use PowerBI to give us some visuals of this data that we deemed important? Maybe some charts and graphs showing important data on a per resolver basis. That'd be pretty cool.
Until next time!


