This post has been republished via RSS; it originally appeared at: Core Infrastructure and Security Blog articles.
In the past part 1 and part 2, I discussed how we can monitor the security and health of our subscription manually. Also, we used Microsoft tools to find security issues with the subscription and discussed how we could resolve them.
Today I would like to discuss another Azure service called Azure Sentinel, to monitor security incidents in our subscription and respond to them.
What is Azure Sentinel?
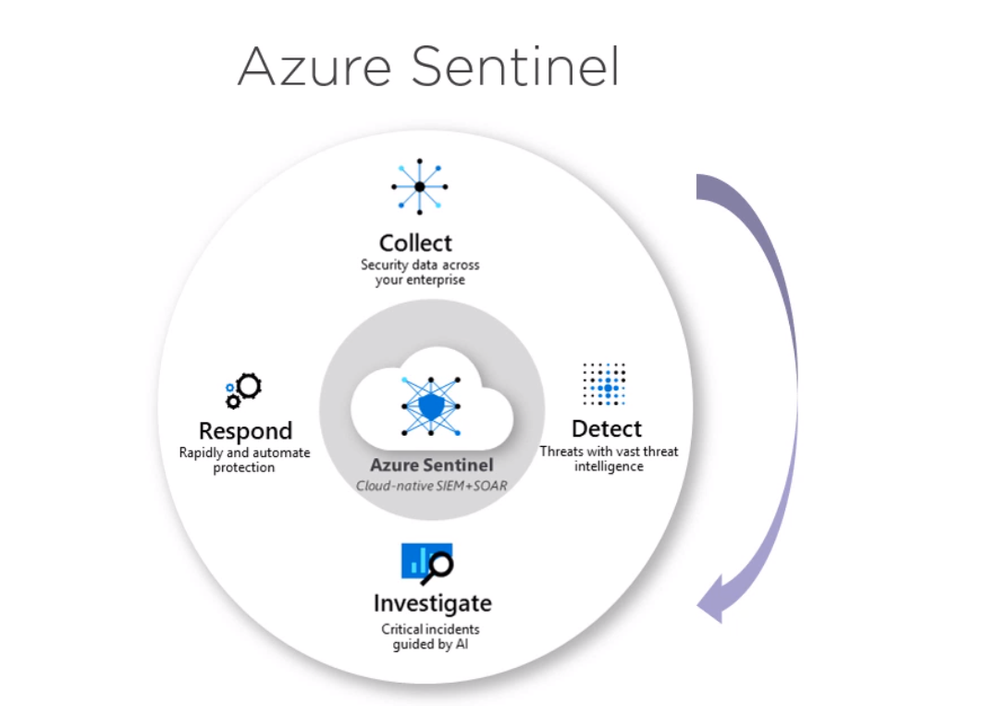
Microsoft Azure Sentinel is a scalable, cloud-native, security information event management (SIEM) and security orchestration automated response (SOAR) solution. Azure Sentinel delivers intelligent security analytics and threat intelligence across the enterprise, providing a single solution for alert detection, threat visibility, proactive hunting, and threat response.
Azure Sentinel is our birds-eye view across the enterprise alleviating the stress of increasingly sophisticated attacks, increasing volumes of alerts, and long resolution time frames.
- Collect data at cloud scale across all users, devices, applications, and infrastructure, both on-premises and in multiple clouds.
- Detect previously undetected threats, and minimize false positives using Microsoft's analytics and unparalleled threat intelligence.
- Investigate threats with artificial intelligence, and hunt for suspicious activities at scale, tapping into years of cybersecurity work at Microsoft.
- Respond to incidents rapidly with built-in orchestration and automation of common tasks.
Using Azure Sentinel, We can collect security data. Then we can use the tools offer by Azure Sentinel to investigate these logs for the events we are interested in.
Also, we can use machine learning backed Azure sentinel tools to detect familiar security incidents. After we found these incidents, we can easily respond to them using responders. This means we can monitor Azure subscription security status or the subscription health and respond to Misconfigurations.
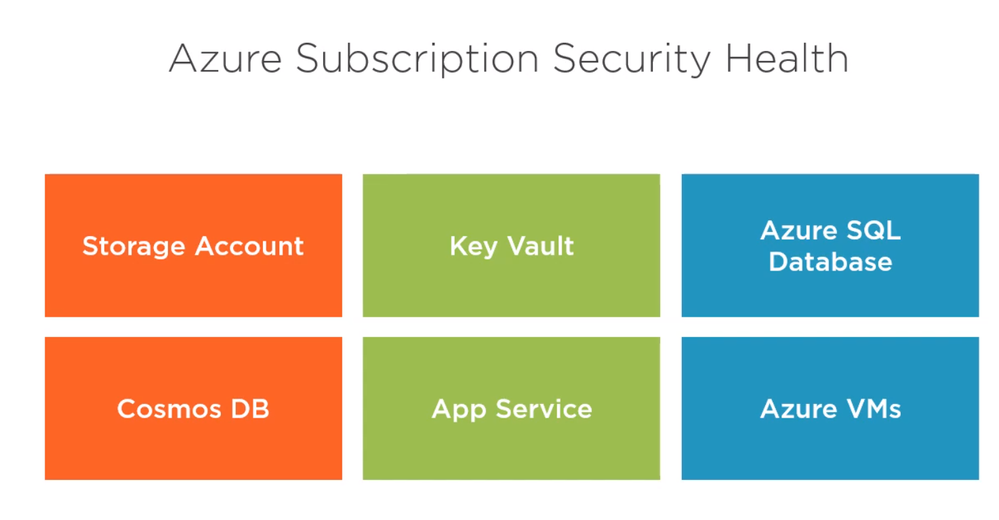
Consider the following example. We have resource group with the following azure services,
What kind of security checks we could enable and monitor
- Storage account: HTTPS is mandatory enabled.
- Key vault: soft-delete is enabled.
- Azure SQL database: Threat detection is enables.
This can be done easily by configuring these services to send their logs to in Azure Sentinel workspace to monitor and report. The following section is a walkthrough demo where we will do the following:
- Provision Sentinel workspace
- Configure resources to send diagnostic logs to Sentinel.
- Configure Sentinel to respond to incidents.
Provision Azure Sentinel Service
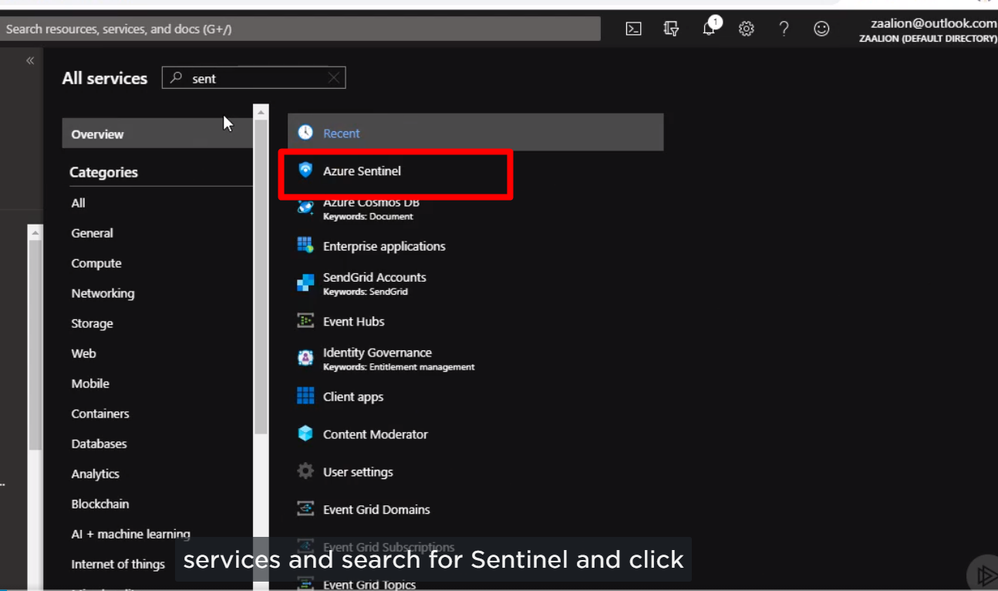
We can select all services, search for Sentinel, and click on Azure Sentinel.
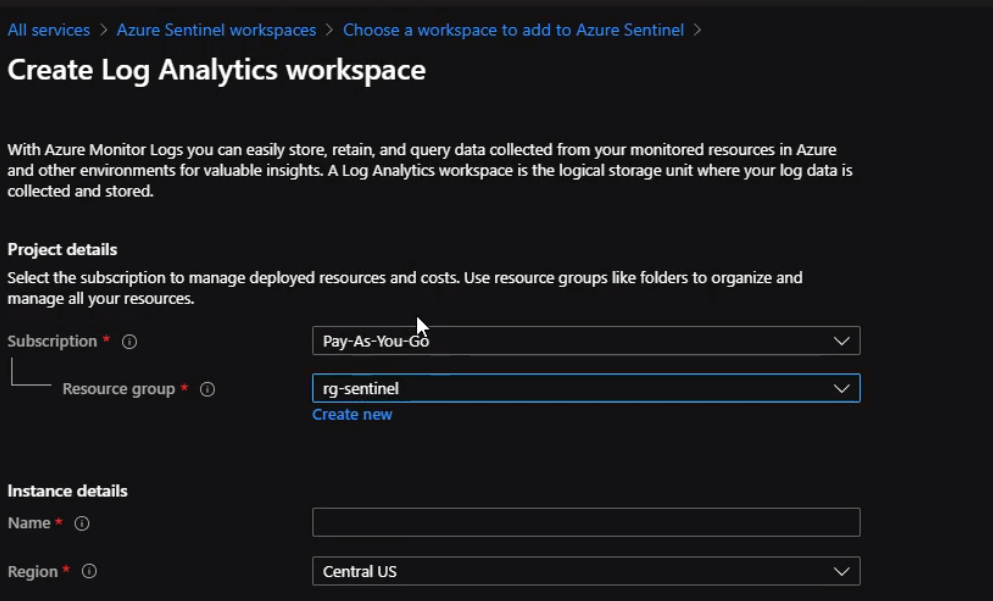
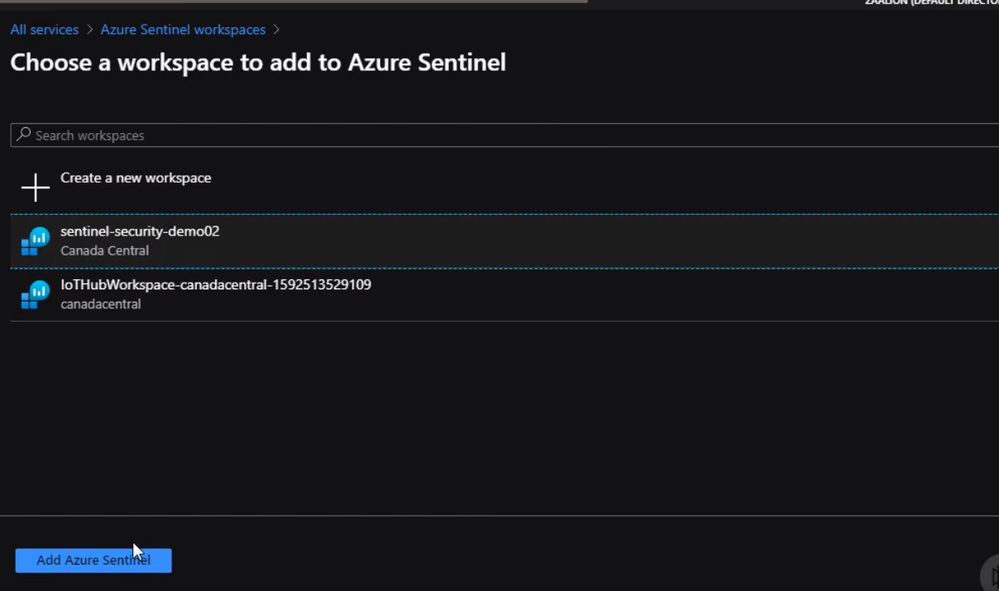
Then we can click Create a new workspace
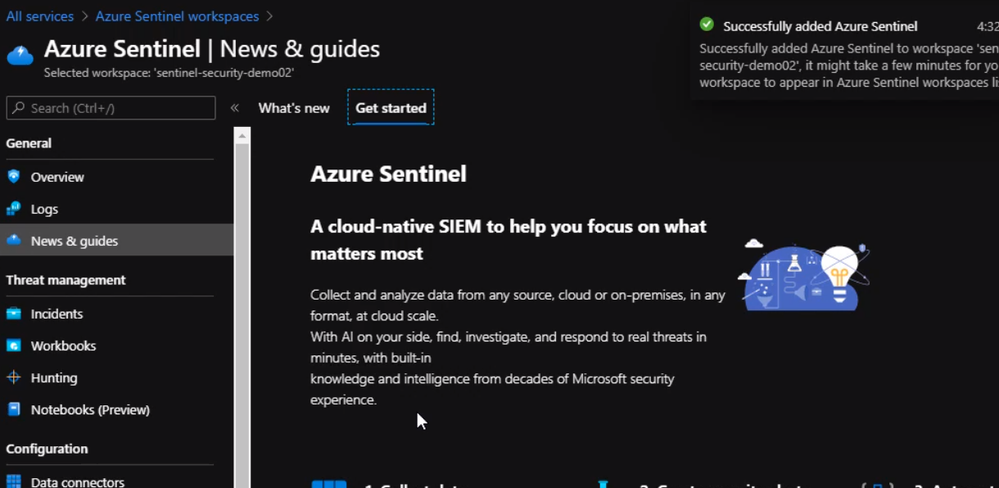
Now, we will give the workspace name and select a region that is suitable for Our resources. Once our workspace is ready then We can click add Azure Sentinel
our Azure sentinel workspace is created. So now we can go ahead and configure a few Azure resources to send logs to this workspace.
Configure resources to send diagnostic logs to Sentinel
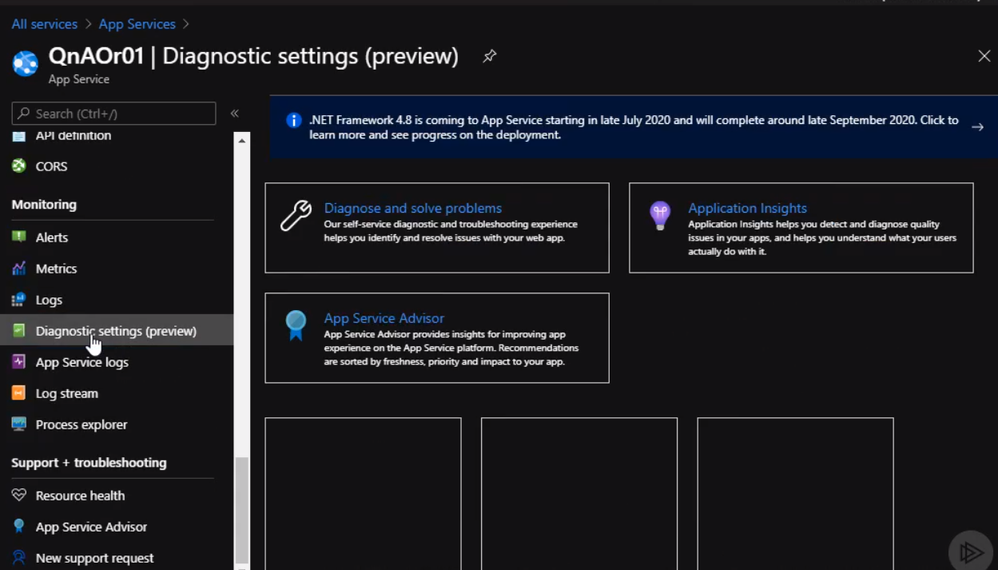
We will start with apps services. From the portal page for the app services, we can scroll down under monitoring, click on diagnostic settings, click on add diagnostic settings.
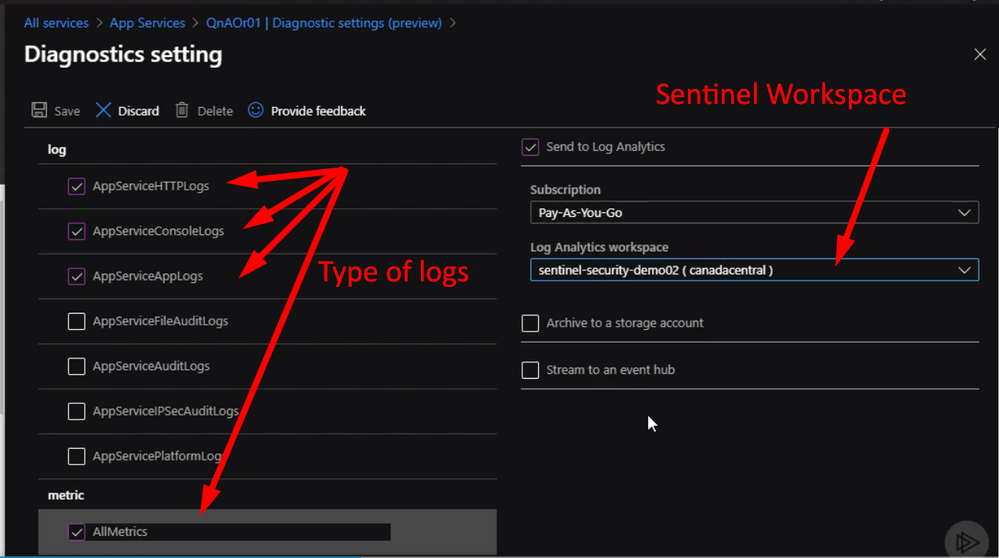
From the Diagnostics setting, we can select a different type of logs to send to Sentinel workspace as following
We can do the same steps with other resources like Azure Key Vault
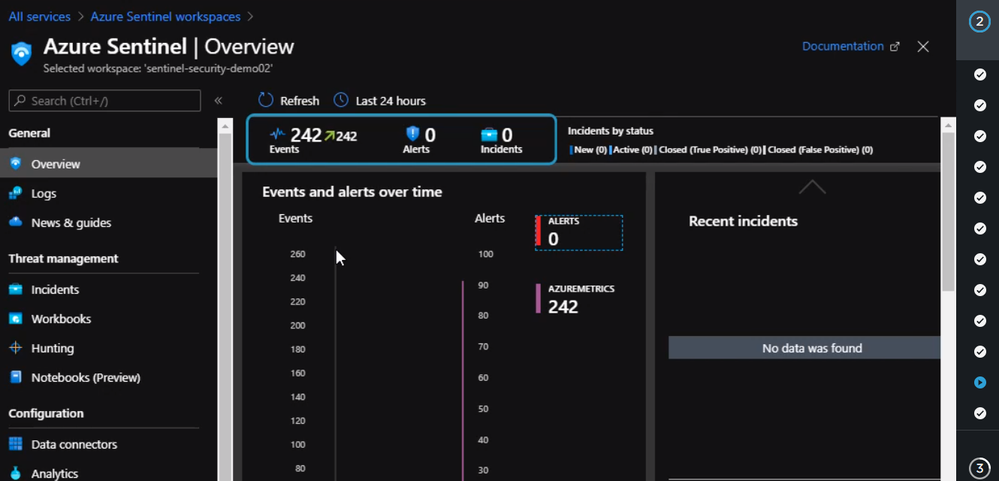
Now if we check the Azure Sentinel workspace page, we will see something like the following.
Configure Azure Sentinel to respond to Incidents
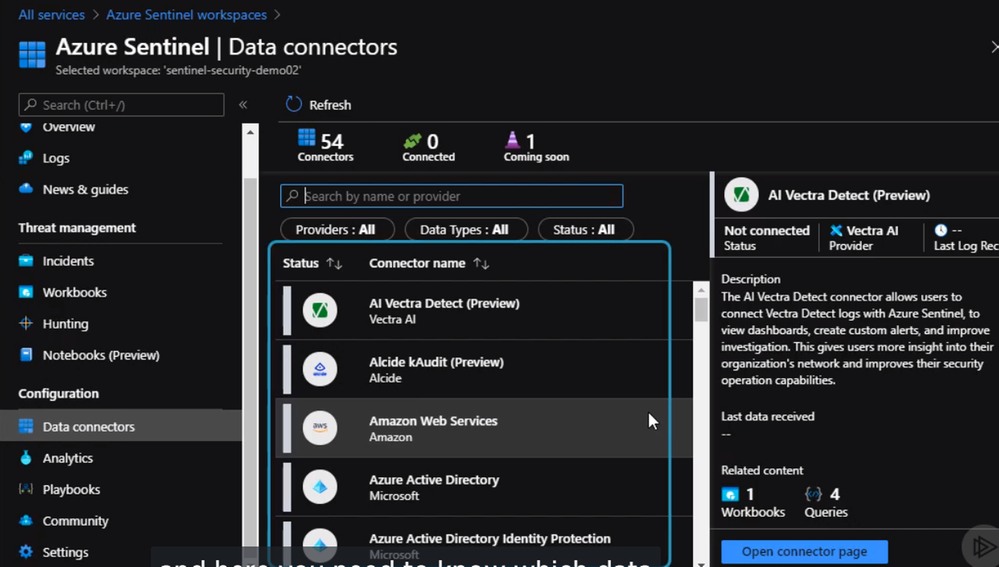
In this section, we will explain how to configure Azure Sentinel to respond to incidents and security violations. First, we need to connect Azure Sentinel to a data source by clicking on data connectors, it will show us a list of data sources.
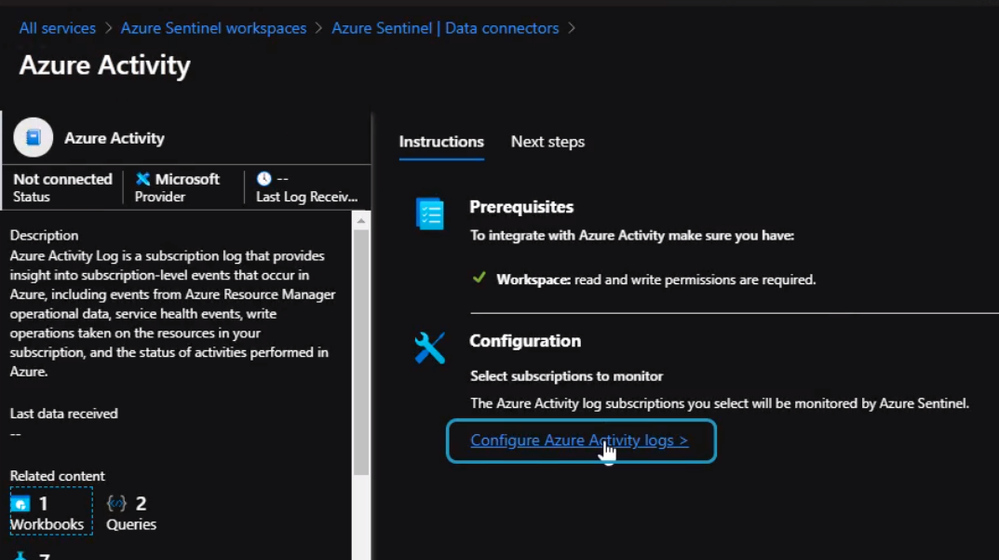
We will configure Azure Sentinel to detect and respond to policy violations in our subscription. In this case, we will need to select Azure Activity as our data connector and click “Configure Azure Activity Logs”
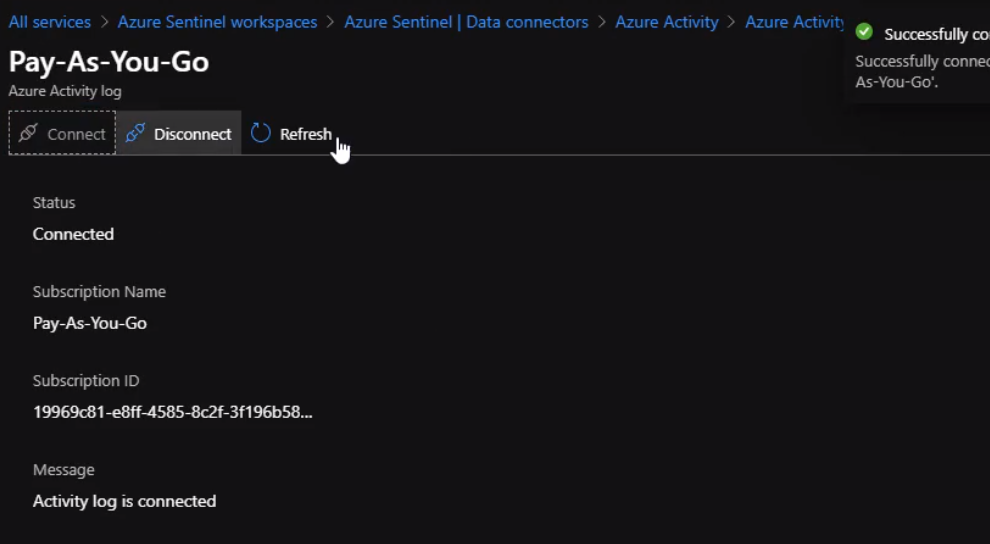
Then we select the subscription and click Log Analytics Connection
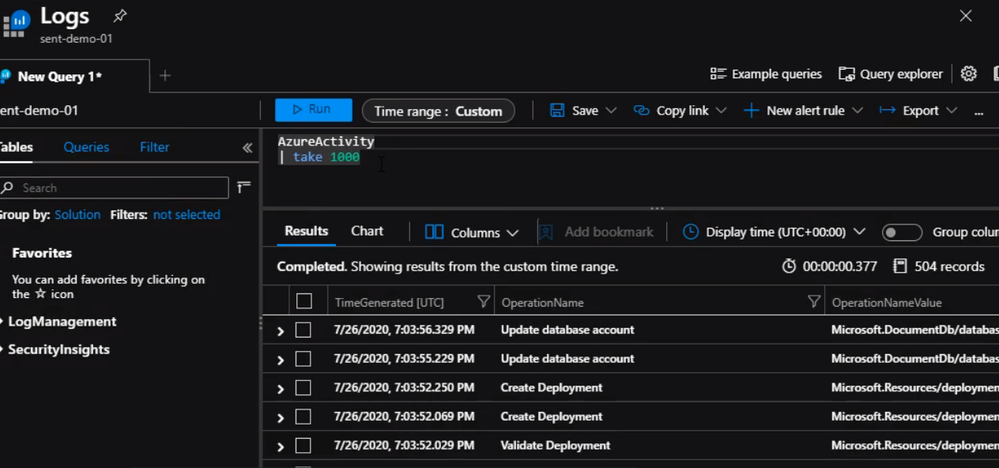
Now, We are connected and Azure sentinel instance can now ingest Azure activity logs. We can check Activity Logs by running a simple query to make sure we are receiving logs
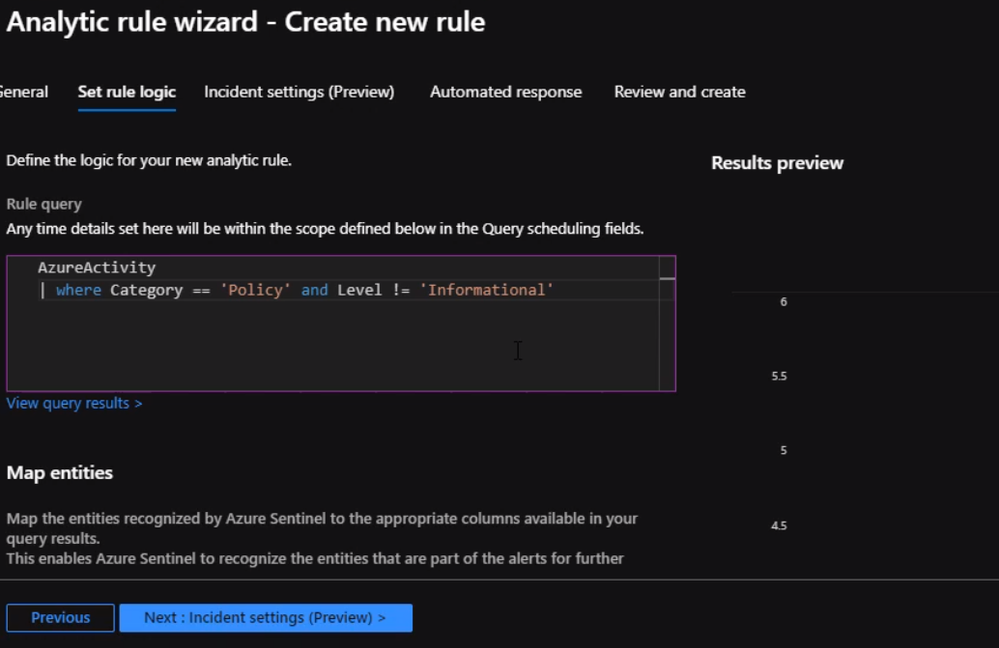
Next step, we will create a query to return policy violations.
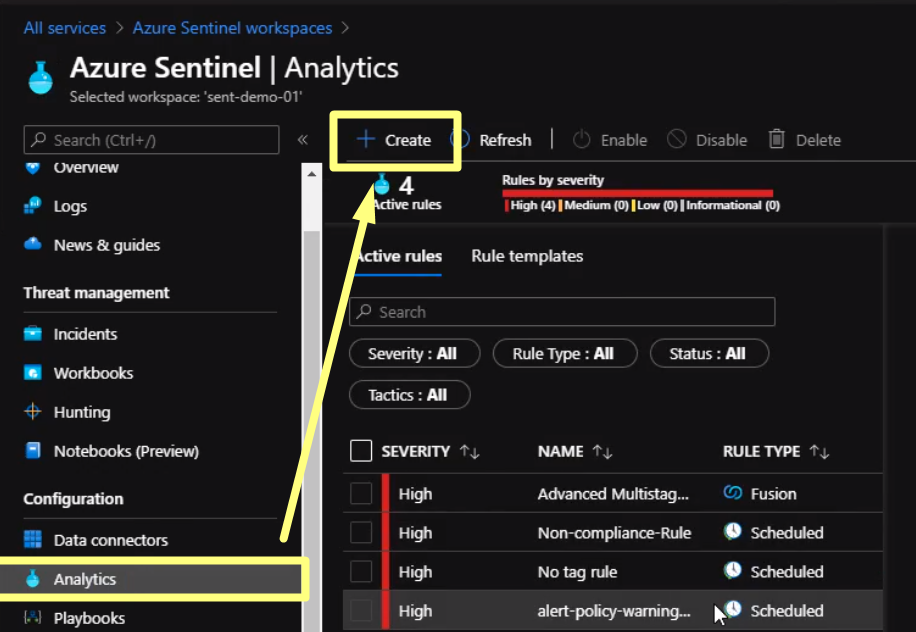
Once we verify the query is working properly, we can start setting the alert. From Sentinel blade click on Analytics and click on “Create” to establish a new rule
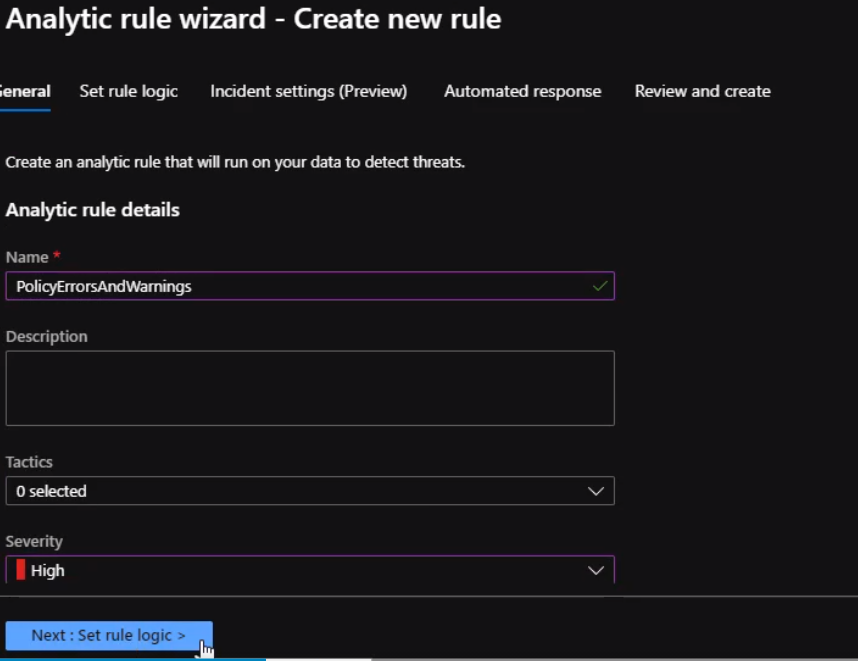
Here we will fill the rule fields and Click Next
Under rule logic, we will enter the query that we created previously.
We will scroll down to specify how often we want the query to run.
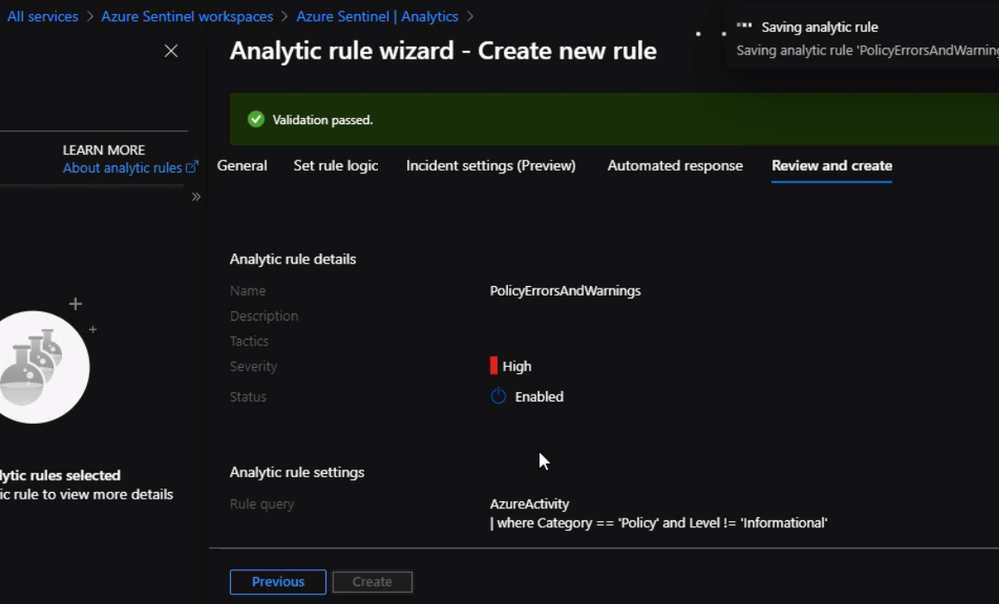
After filling the schedule, we can click on Incident settings where we need to specify how we want Azure Sentinel to respond to the incident. If we do not have a playbook set up yet we can just click “Review” and create the alert
Next, we will add a new logic app to respond to the alert we just created in the above section.
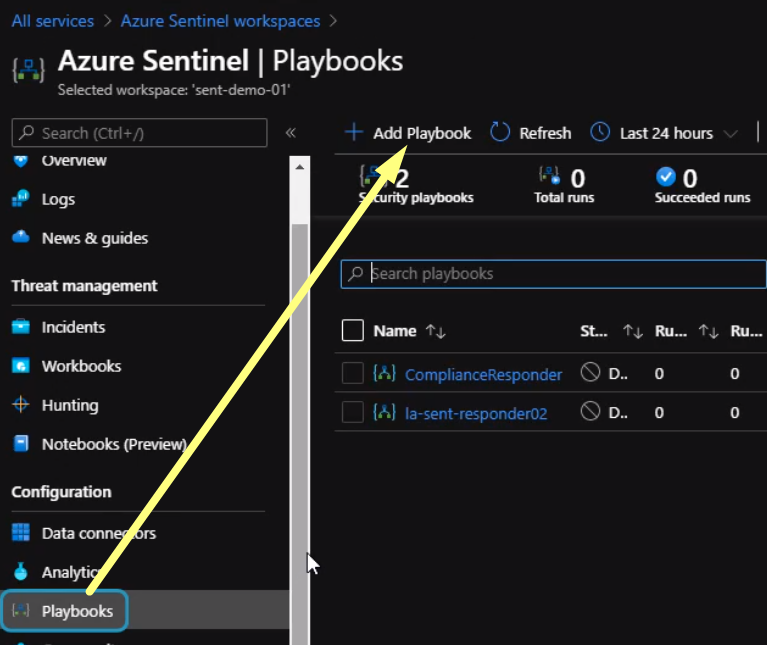
From the Playbooks section click create a new playbook
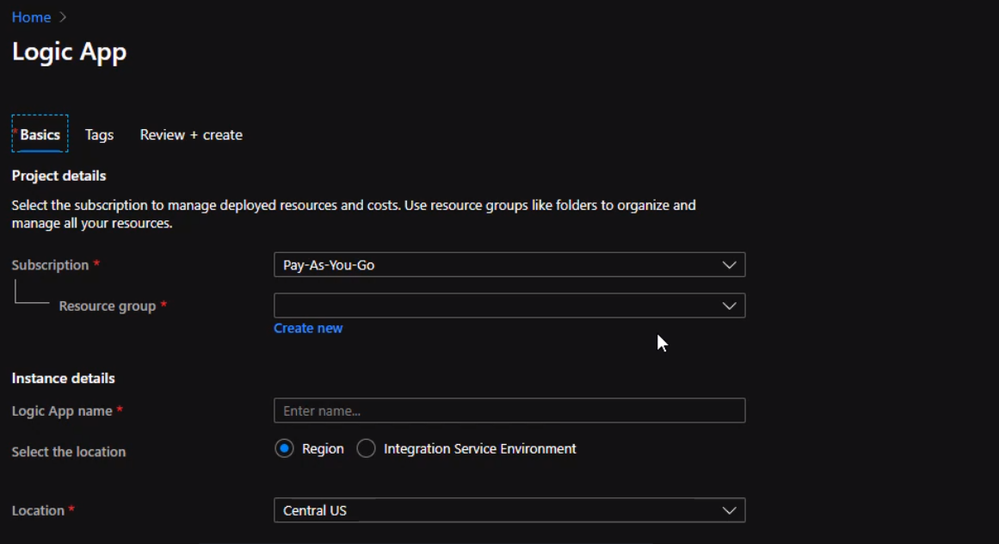
We will be redirected to a new page to create a logic app
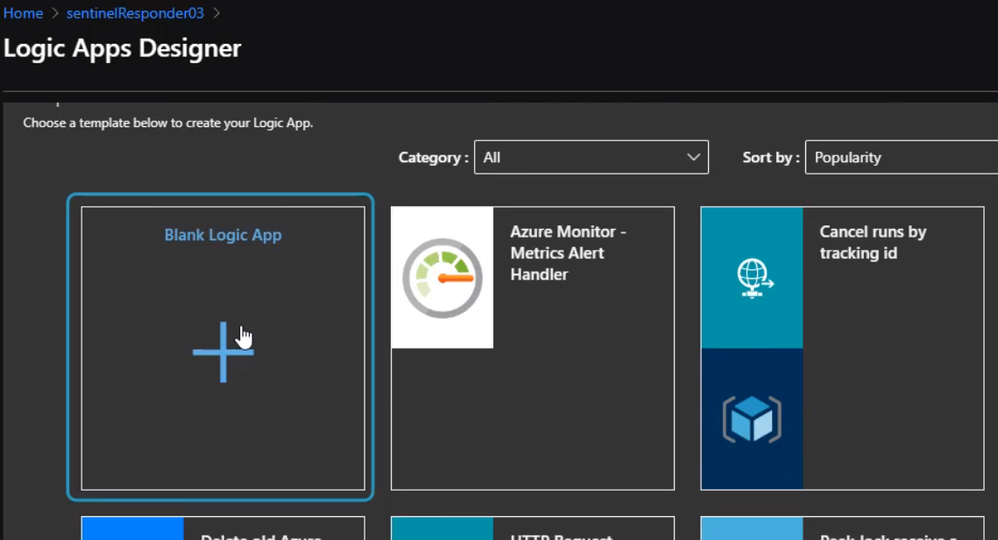
Once the logic app is created, we can review the “Overview page” and select “Blank Logic App”
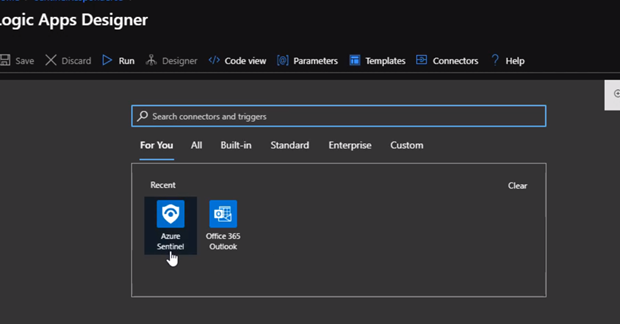
The only difference between an ordinary logic, app, and responder is the first action. The first action here should be Azure sentinel. Also if it is not showing, we can simply search for it.
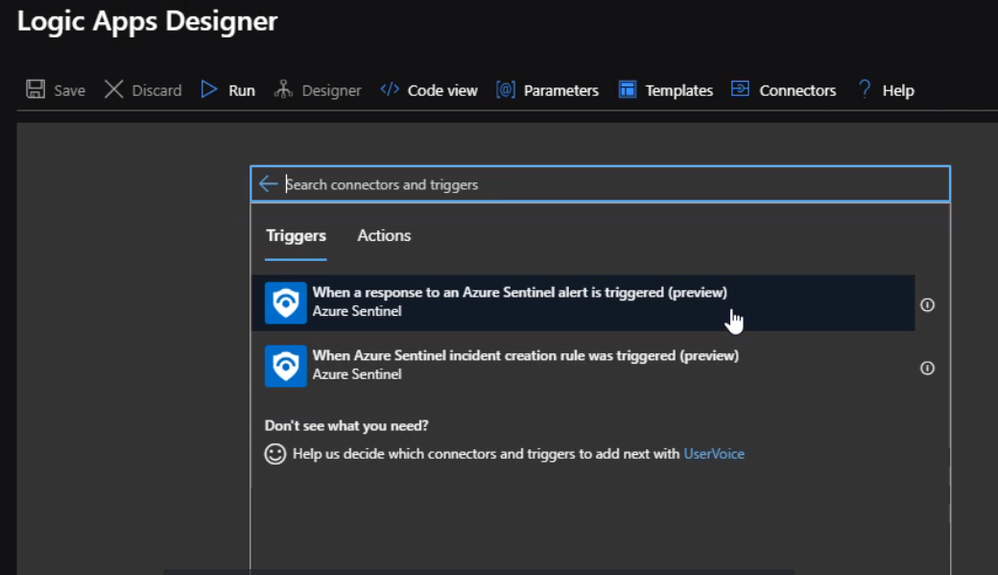
Now, we will choice respond to Azure Sentinel Alert
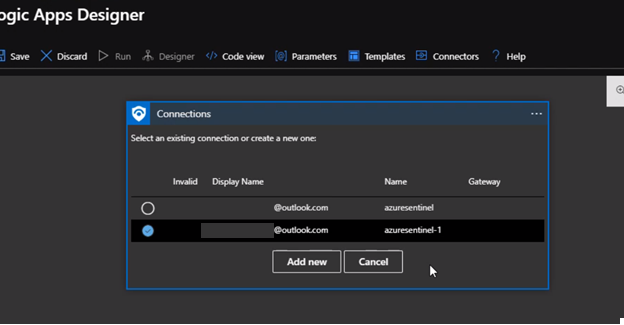
Next will select the connection to connect to the Azure Sentinel Workspace instance
Once we complete the connections by choosing an existing one or create a new one. We can use the Get entities functions, which enable us to get the relevant entities from inside the Entities list, such as accounts, IP addresses, and hosts. This will enable us to run actions on specific entities.
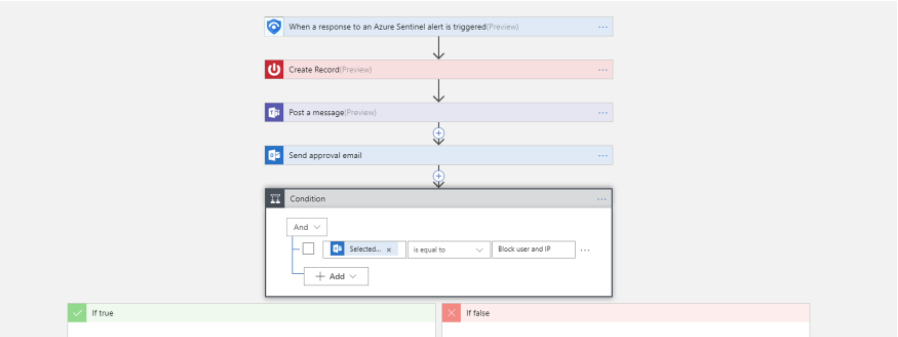
Now, We can define what happens when we trigger the playbook. We can add an action, logical condition, switch case conditions, or loops. For example, once an alert is triggered it will send an email and post a message in Team. Please review Logic App for more information
The last step now, we need to configure the alert to use the playbook we just created.
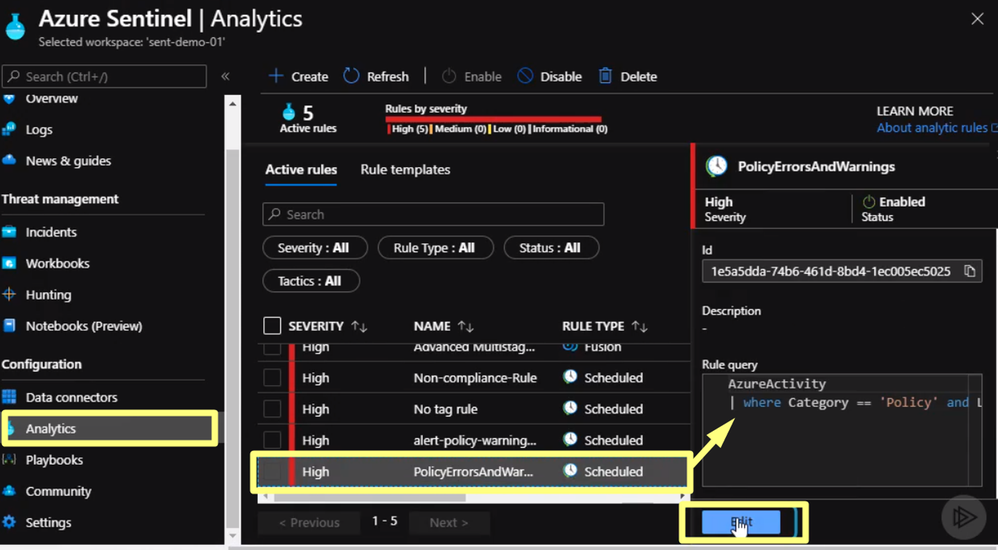
We start by clicking analytics and select the alert we click Edit
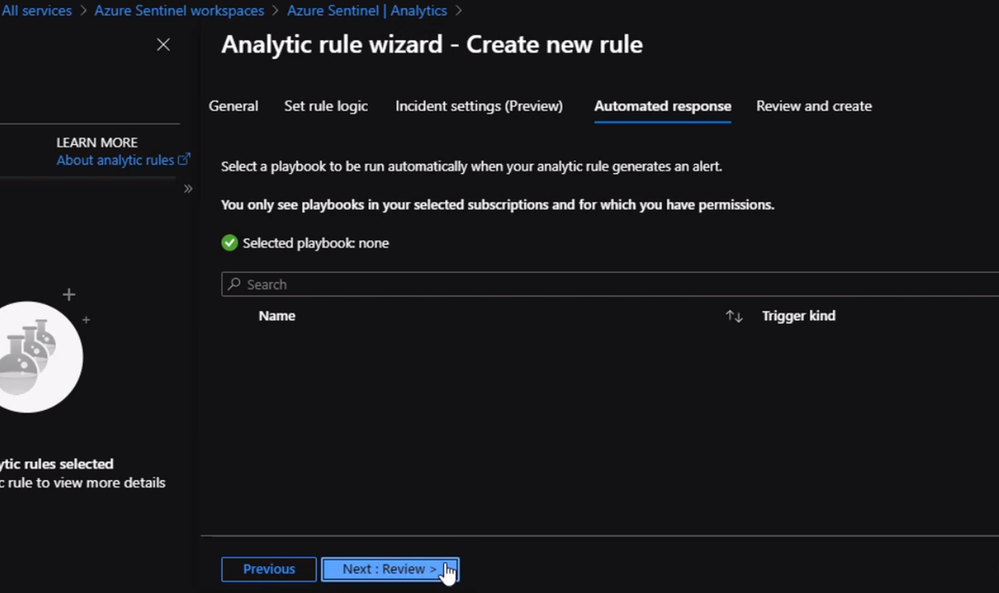
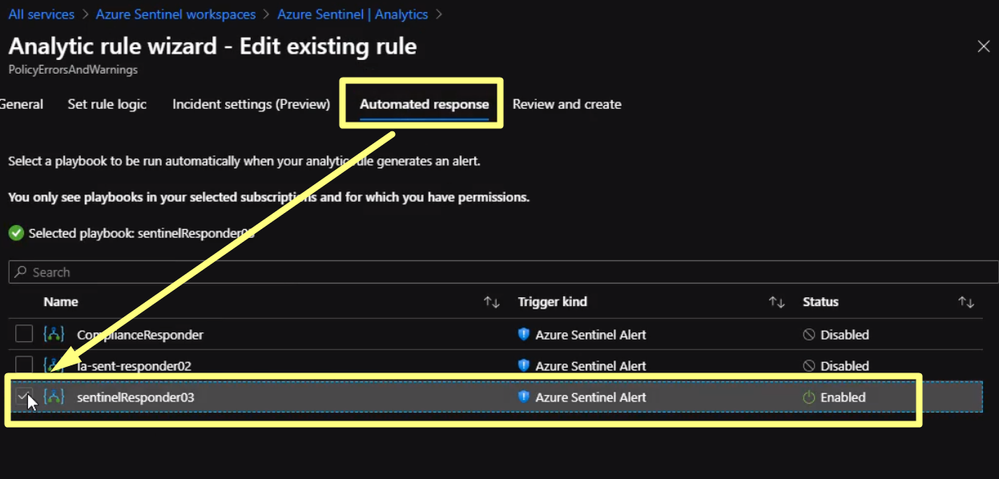
Click on Automated Response then click on the playbook we just created in the previous section
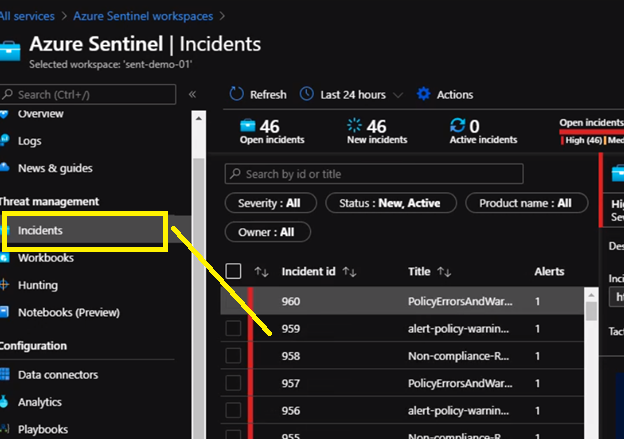
Then click Review and save. Now if any resource will violate the policy in place we will be notified from Azure Sentinel. Also, we can check Incidents Review to check all the violation and incident As we can see it is extremely easy to use Azure Sentinel to respond to security events threatening the health of our subscription
Summary
In this series, we talked about the importance of security. There are two aspects of security validations, credentials in the code, and Azure subscription security.
We discussed CredScan tool and how we can use it automatically The credits can Tool has two flavors. Clients and server-side, the clients is a visual studio extension, which we can install on the developers' machine. So, each time the developer builds the solution, they'll get a list of warnings of the credentials in the coat. The Server side can be integrated into the continuous integration pipeline. So each time a bill kicks off, CredScan is going to look for credentials in the code.
In the second blog, we talked about AzSK. This tool can be used to run security health checks for Azure subscriptions.
In the final blog, we talked about Azure Sentinel and talked about how we can provision it and how we can configure azure resources to send diagnosis logs to Azure Sentinel. We also talked about how to set an incident alert and how to configure a playbook to respond to the alert as an automated response for an incident.
Thank you for reading, I hope the information is useful to you.

