This post has been republished via RSS; it originally appeared at: Core Infrastructure and Security Blog articles.
Introduction
This is John Barbare and I am a Sr. Customer Engineer at Microsoft focusing on all things in the Cybersecurity space. This is the second part of the series of Microsoft 365 Defender as you can view the first part here. In this blog I will go over the new unified Microsoft 365 Defender Security Portal and go into detail of investigating an incident, the correlation of alerts, and a detailed look at what Automated Investigation does and how it can help your organization. With that said, lets jump into Microsoft 365 Defender and look at a real incident and see how Microsoft 365 Defender can work for your organization.
Investigate Incidents in Microsoft 365 Defender
An incident is a collection of correlated alerts that make up the story of an attack. Malicious and suspicious events that are found in different device, user, and mailbox entities in the network are automatically aggregated by Microsoft 365 Defender. Grouping related alerts into an incident gives security defenders a comprehensive view of an attack.
For instance, security defenders can see where the attack started, what tactics were used, and how far the attack has gone into the network. They can also see the scope of the attack, like how many devices, users, and mailboxes were impacted, how severe the impact was, and other details about affected entities.
Having Automated Investigation or AIR (Automated Investigation and Response) set to full, Microsoft 365 Defender can automatically investigate and resolve the individual alerts through automation, various inspection algorithms, and artificial intelligence. AIR capabilities are designed to examine alerts and take immediate action to resolve breaches. AIR capabilities significantly reduce alert volume, allowing security operations to focus on more sophisticated threats and other high-value initiatives. All remediation actions, whether pending or completed, are tracked in the Action center. In the Action center, pending actions are approved (or rejected), and completed actions can be undone if needed.
Security defenders can also perform additional remediation steps to resolve the attack straight from the incidents view. Incidents from the last 30 days are shown in the incident queue. From here, security defenders can see which incidents should be prioritized based on risk level and other factors. Security defenders can also rename incidents, assign them to individual analysts, classify, and add tags to incidents for a better and more customized incident management experience. Microsoft 365 Defender aggregates all related alerts, assets, investigations, and evidence from across your devices, users, and mailboxes to give you a comprehensive look into the entire breadth of an attack. Investigate the alerts that affect your network, understand what they mean, and collate evidence associated with the incidents so that you can devise an effective remediation plan.
Investigate an Incident
Select an incident from the incident queue. A side panel opens and gives a preview of valuable information such as status, severity, categories, and the impacted entities. Any machines tags that have been assigned to the device(s) will also be displayed. Select Open incident page.
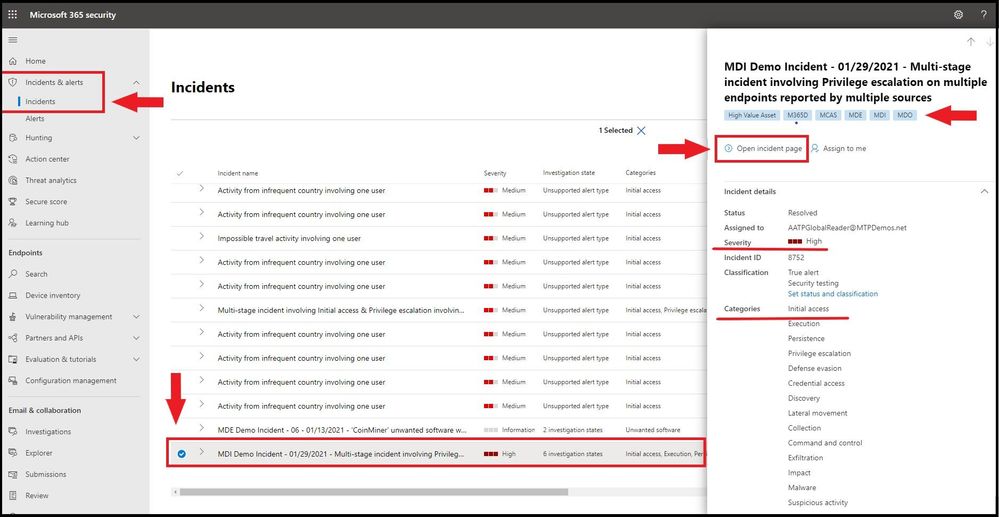
Incident Page Overview
This opens the incident page where you will find more information about incident details, comments, and actions, tabs (overview, alerts, devices, users, investigations, evidence). Review the alerts, devices, users, other entities involved in the incident. The overview page gives you a snapshot glance into the top things to notice about the incident.

The attack categories give you a visual and numeric view of how advanced the attack has progressed against the kill chain. As with other Microsoft security products, Microsoft 365 Defender is aligned to the MITRE ATT&CK™ framework. The scope section gives you a list of top impacted assets that are part of this incident. If there is specific information regarding this asset, such as risk level, investigation priority as well as any tagging on the assets this will also surface in this section.
The alerts timeline provides a sneak peek into the chronological order in which the alerts occurred, as well as the reasons that these alerts linked to this incident. And last - the evidence section provides a summary of how many different artifacts were included in the incident and their remediation status, so you can immediately identify if any action is needed on your end. This overview can assist in the initial triage of the incident by providing insight to the top characteristics of the incident that you should be aware of.
Assigning the Incident
Once you have the Incident open, you will need to assign the incident. Select the Manage incident tab on the far right.
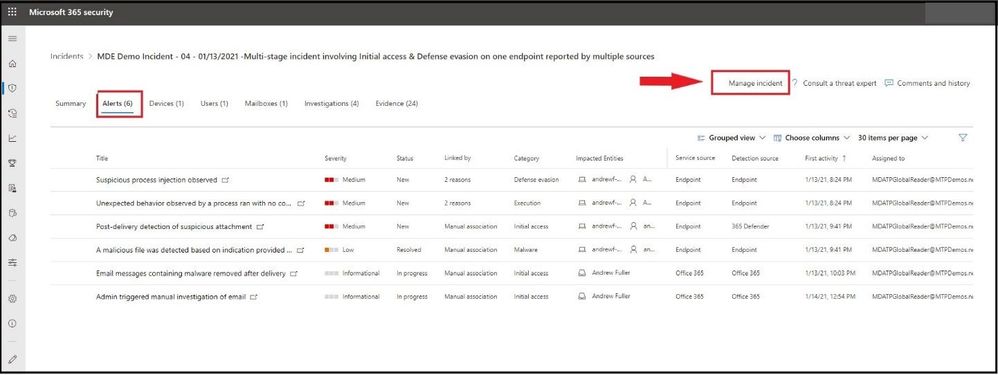
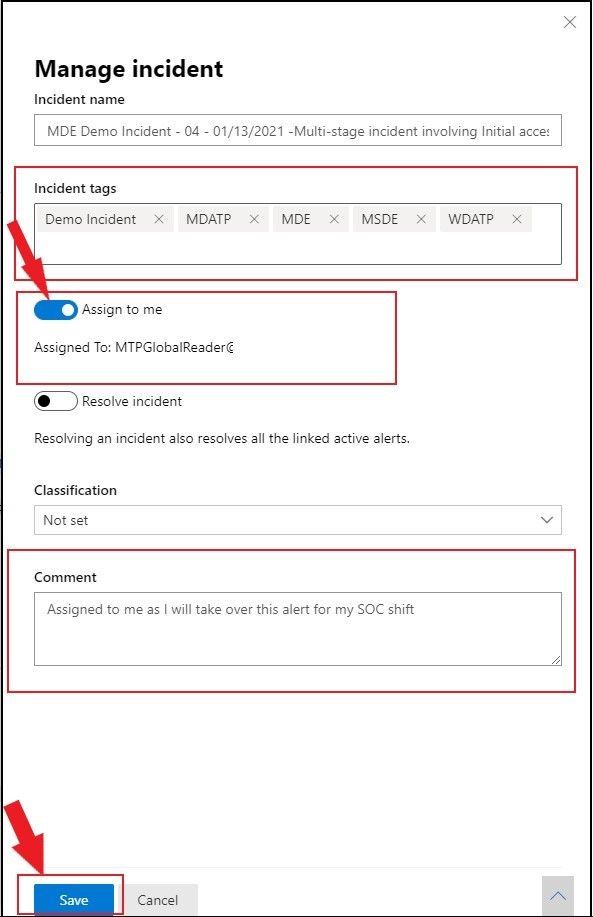
Once selected, a flyout card will appear on the far right. Here you will be able to add any new Incident tags to the alert, assign to yourself, and add any comments for the alert. Currently without investigating the incident, you cannot resolve the incident or set the classification at this time.
The incident name is automatically generated and changes dynamically when added details or insights emerge. Modifying the incident name will prevent the system from updating the name based on future insights. You can modify the incident name to better align with your preferred naming convention if possible. After entering the correct information, go ahead and select save.
Alerts
You can view all the alerts related to the incident and other information about them such as severity, entities that were involved in the alert, the source of the alerts (Microsoft Defender for Identity, Microsoft Defender for Endpoint, Microsoft Defender for Office 365) and the reason they were linked together. Go ahead and select the Alerts tab at the top.

By default, the alerts are ordered chronologically, to allow you to first view how the attack played out over time. Clicking on each alert will lead you to the relevant alert page where you can conduct an in-depth investigation of that alert. In the Detection source tab under the alert section is which source pulled all the alert from. In this incident, one can see alerts from Microsoft Defender for Endpoint (Endpoint and 365 Defender) and Defender for Office 365 (Office 365).

For any alert(s), you will want to investigate each alert listed under the Title column. For this Incident, we will select the first alert (Suspicious process injection observed) to investigate as part of the investigation. A flyout card will open and we can see details about this alert. We can see from here it was an Automated Investigation (#1859) that triggered this alert and is Partially Investigated. Also, all the alert details to include Incident name, service source, detection technology, detection status, category, Techniques, first/last activity seen, and when the alert was generated on.
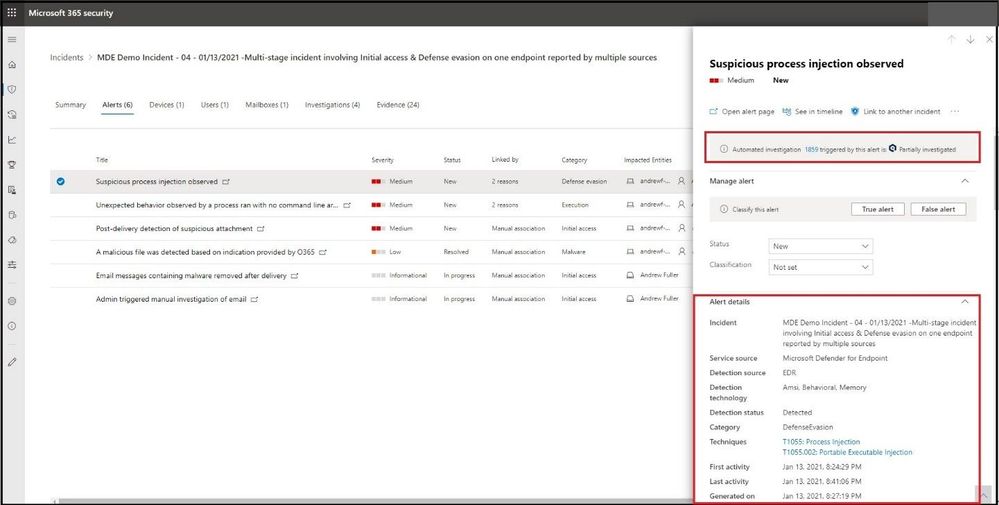
If we scroll further down the card on the right, we receive an alert description which informs us about the alert. We can also see the list of alert recommended actions to take. Next, is the Automated investigation details and incident details with any comments that have been added to this open incident. From the card, select the Open alert page.
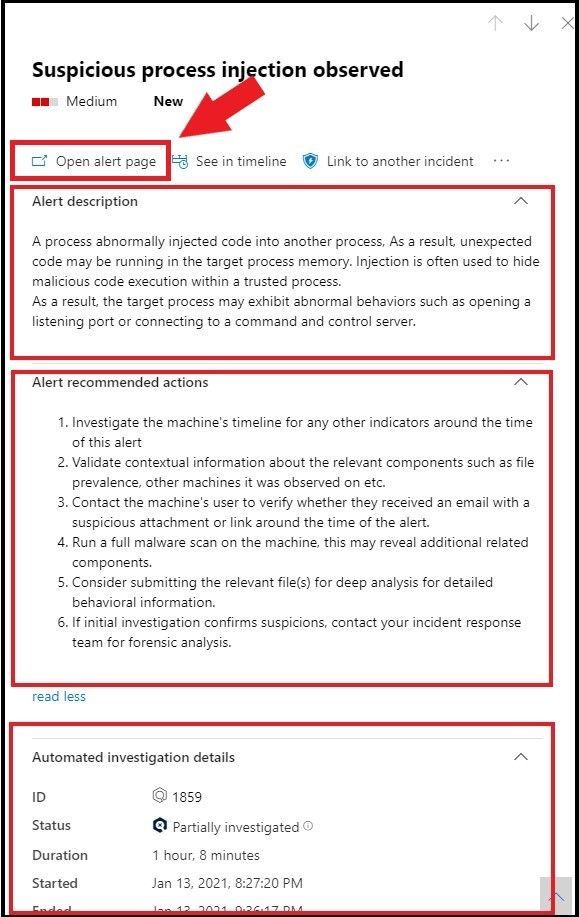
Opening the Alert Page
Once the Open alert page has been selected, it will pivot to the alert inside Microsoft Defender for Endpoint. This will give us more fine grained information to include the alert story and all other permanent information about the alert. If we see something we want to further investigate, select the drop down arrows at the end of each horizontal bar.

In this alert, we selected the “powershell.exe launched a script inspected by AMSI”. Once selected, we can see the actual script that was run and why it was flagged as a suspicious process injection. This goes with any script-based attack as you can view the actual script that was run. You can copy the script and/or download the script as seen on the far right.

From here, we can continue to investigate the alert story to gather more evidence on the alert, go to the machine timeline to see what happened before and after the alert, and drill down to more details until a classification is warranted for a True/False positive for the classification.
Devices
The devices tab lists all the devices where alerts related to the incident are seen.
Clicking the name of the machine (under device name ) where the attack was conducted navigates you to its Machine page where you can see alerts that were triggered on it and related events provided to ease investigation.

Selecting the Timeline tab enables you to scroll through the machine timeline and view all events and behaviors observed on the machine in chronological order, interspersed with the alerts raised (on the timeline with down arrow).
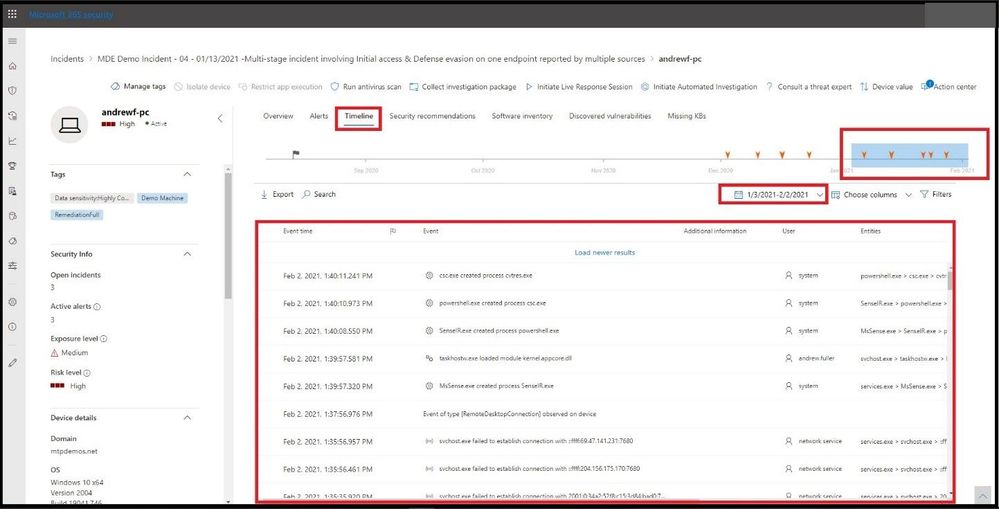
Users
See users that have been identified to be part of, or related to a given incident.
Clicking the username navigates you to the user's Cloud App Security page where further investigation can be conducted. Here we will go ahead and select the user.

After selecting the user, we pivot to see the user's profile, investigation priority score, alerts, and risky activities, and other information.
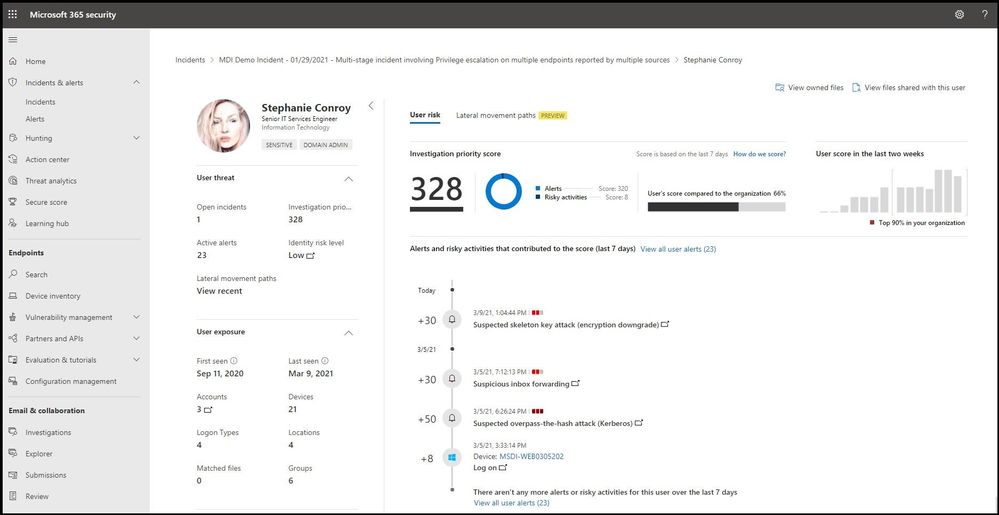
Mailboxes
Investigate mailboxes that have been identified as part of or related to an incident. To do further investigative work, selecting the mail-related alert will open Defender for Office 365 where you can take remediation actions.

After selecting the user’s mailbox, we pivot to Defender for Office 365 to investigate the user's mailbox. Using Explorer in Threat Management is a near real-time tool to help Security Operations teams investigate and respond to threats in the Security & Compliance Center. Learn more about Explorer.
This view shows information about all email messages sent by external users into your organization, or internal email sent between your users. This view can help you find missed threats. You can filter the view for threat hunting, and you can export up to 200,000 records for offline analysis.
Top 5 categories are shown by default; however, the chart can contain more than five categories of threats. Note that all filters used are manual, are applied upon clicking Refresh, and that the Advanced view contains a NOT condition for certain filters, and for creating complex queries. Use Threat Explorer rather than Export to see all records.
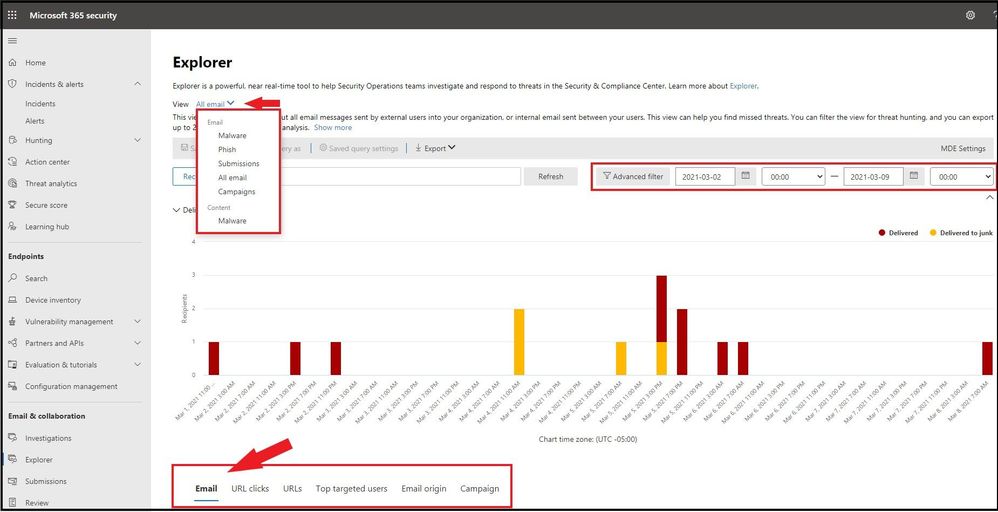
Investigations
Select Investigations to see all the automated investigations triggered by alerts in this incident. The investigations will perform remediation actions or wait for analyst approval of actions, depending on how you configured your automated investigations to run in Microsoft Defender for Endpoint and Defender for Office 365.

Select an investigation to navigate to the Investigation details page to get full information on the investigation and remediation status. If there are any actions pending for approval as part of the investigation, they will appear in the Pending actions tab. Take action as part of incident remediation.
We selected the first investigation “Suspicious process injection observed” and will pivot to the investigation details to see all investigation details.
One can select any of the tabs to see further details on the investigation, evidence, entities, and logs.

Evidence
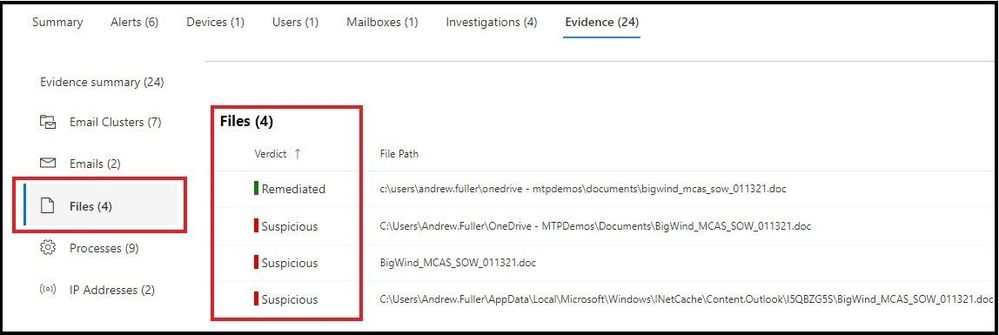
Microsoft 365 Defender automatically investigates all the incidents' supported events and suspicious entities in the alerts, providing you with auto response and information about the important files, processes, services, emails, and more. This helps quickly detect and block potential threats in the incident.

Each of the analyzed entities will be marked with a verdict (Malicious, Suspicious, Clean) as well as a remediation status. This assists you in understanding the remediation status of the entire incident and what are the next steps that can be taken to further remediate.
Conclusion
Thanks for taking the time to read this blog and I hope you have a better understanding of how an investigation works using Auto IR in Microsoft 365 Defender. I have implemented Microsoft 365 Defender in several large organizations and it has drastically reduced alert fatigue and has SOC (Security Operations Centers) personnel focus more on high level alerts while Microsoft 365 performs all the other investigations in the background.
Hope to see you in the next blog and always protect your endpoints!
Thanks for reading and have a great Cybersecurity day!
Follow my Microsoft Security Blogs: http://aka.ms/JohnBarbare and also on LinkedIn.
References
Microsoft 365 Defender - Microsoft 365 security
