This post has been republished via RSS; it originally appeared at: New blog articles in Microsoft Tech Community.
What is Page cannot be displayed?
There are certain scenarios in which when we try to browse a site hosted on IIS server, we end up getting Page cannot be displayed (PCBD) . There are several reasons for which we will eventually get PCBD , some of the reasons are :
- Network related problems
- Improper bindings on IIS
- Improper certificates on IIS
- Incorrect settings on Http.Sys
In most of the scenarios the request doesn’t even reach to the IIS layer and fails before that . Here is a nice article explaining about layers of service that a request has to travel: https://techcommunity.microsoft.com/t5/iis-support-blog/iis-services-http-sys-w3svc-was-w3wp-oh-my/ba-p/287856
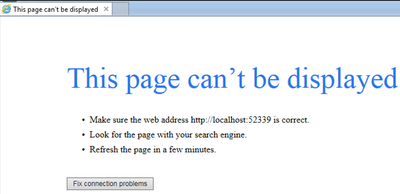
Generally, a PCBD error looks like below:
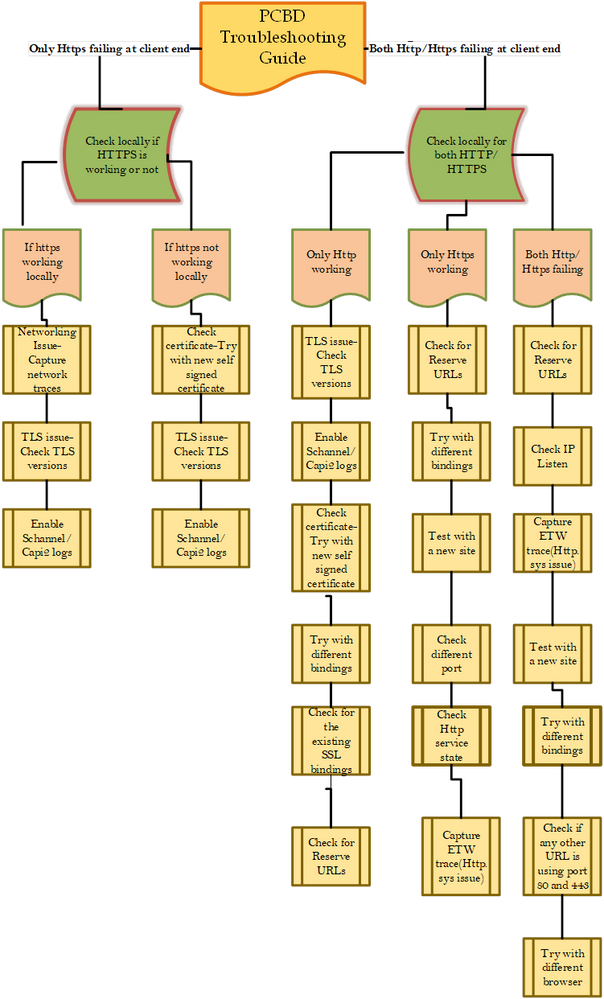
This blog will focus on list of steps which are going to be useful for troubleshooting these kinds of scenarios .Here, I have created a Flow chart:
There are several steps in the flow chart which require data collection , just listing a few of them here:
Steps for capturing Schnannel logs and Capi2 logs :
Schannel Logs:
- Start Registry Editor. To do this, click Start, click Run, type regedt32, and then click OK.
- Locate the following key in the registry:
- HKEY_LOCAL_MACHINE\System\CurrentControlSet\Control\SecurityProviders\SCHANNEL
- On the Edit menu, click Add Value, and then add the following registry value:
- Value Name: EventLogging
- Data Type: REG_DWORD
- Note After you add this property, you must give it a value. See the table in the "Logging options" section to obtain the appropriate value for the kind of events that you want to log.
- Exit Registry Editor.
- Click Start, click Shut Down, click to select Restart, and then click OK to restart the computer. (Logging does not take effect until after you restart the computer).
Logging options:
The default value for Schannel event logging is 0x0000 in Windows NT Server 4.0, which means that no Schannel events are logged. In Windows 2000 Server and Windows XP Professional, this value is set to 0x0001, which means that error messages are logged. Additionally, you can log multiple events by specifying the hexadecimal value that equates to the logging options that you want. For example, to log error messages (0x0001) and warnings (0x0002), set the value to 0x0003.
Value Description
0x0000 Do not log
0x0001 Log error messages
0x0002 Log warnings
0x0004 Log informational and success events
From https://support.microsoft.com/en-in/help/260729/how-to-enable-schannel-event-logging-in-iis
Capi2 Logs :
The CryptoAPI 2.0 Diagnostics is a feature available on Windows Server 2008+ that supports the trouble shooting of issues concerned with, for example: Certificate Chain Validation Certificate Store Operations Signature Verification
This article describes how to enable the CAPI2 Diagnostic, but for an in depth review of the capability, check here.
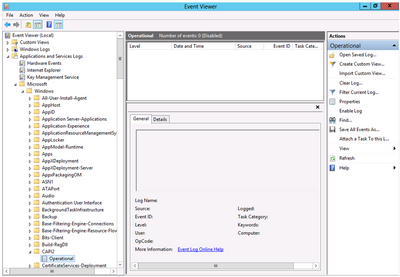
Enable CAPI2 logging by opening the Event Viewer and navigating to the Event Viewer (Local)\Applications and Services Logs\Microsoft\Windows\CAPI2 directory and expand it. You should see a view named Operational as illustrated in Figure 1.
Figure 1, CAPI2 Diagnostics in Event Viewer
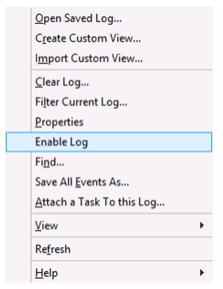
Next, right-click on the Operational view and click the Enable Log menu item as shown in Figure 2.
Figure 2, Enable CAPI2 Event Logging
Once enabled, any warnings or errors are logged into the viewer. Reproduce the problem you are experiencing and check if the issue is logged.
Command for checking Reserved URLs:
The above command lists DACLs (discretionary access control list ) for the specified reserved URL or all reserved URLs.
Command for checking Http.sys Service State:
The above command shows snapshot of Http service .
Command for checking the IP Listen:
The above command lists all IP addresses in the IP listen list. The IP listen list is used to scope the list of addresses to which the HTTP service binds. "0.0.0.0" means any IPv4 address and "::" means any IPv6 address
Capturing Network trace -
To capture Network trace using Netmon tool…please check out this link : https://docs.microsoft.com/en-us/windows/client-management/troubleshoot-tcpip-netmon
Steps for capturing Http.sys ETW trace:
Capture a Perfview trace with IIS ETW providers. You can download Perfview from : https://github.com/microsoft/perfview/releases/tag/P2.0.71
Before starting the Pervfiew trace just run this command in admin command prompt (this captures http.sys traces), also start the other traces:
Make some 5-6 requests from client (http requests not https).. Once they fail, stop all of them, then run the below command to stop the command
This netsh trace will be saved on C drive with the name “minio_http.etl”..
Hope this one helps you.
Happy troubleshooting !!! :smiling_face_with_smiling_eyes:


