This post has been republished via RSS; it originally appeared at: New blog articles in Microsoft Tech Community.
This article helps you to set up Azure Monitor in Service Fabric Cluster to monitor and diagnose a cluster using events.
Step:1
Create Log Analytics workspace under Same or Different Resource group
Step:2
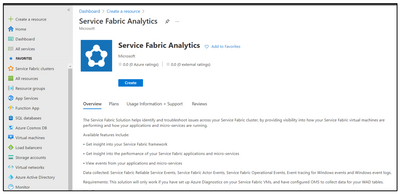
Create Service Fabric Analytics from Left Pane on the Portal and Associate the Log Analytics workspace created in Step#1
Step 3:
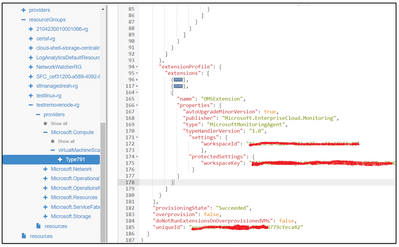
As per the guidelines in https://docs.microsoft.com/en-us/azure/virtual-machines/extensions/oms-windows#extension-schema, append the OMS extension to VMSS level extensions list.
Can be performed via Resource Explorer.
Step: Go to https://resources.azure.com/ -> Subscription -> Resource Group -> Microsoft.Compute -> Click on VMSS resource name
{
"name": "OMSExtension",
"properties": {
"autoUpgradeMinorVersion": true,
"publisher": "Microsoft.EnterpriseCloud.Monitoring",
"type": "MicrosoftMonitoringAgent",
"typeHandlerVersion": "1.0",
"settings": {
"workspaceId": "46aa5e9a-xxxx-xxxx-xxxx-xxxxxxx"
},
"protectedSettings": {
"workspaceKey": "xxxxxxxxxxxxxxxxxxxxxxxxxxxx==" }
}
}
Wait for provisioning to Succeeded.
Now, the OMS Log Analytics is integrated with VMSS.
Step 4:
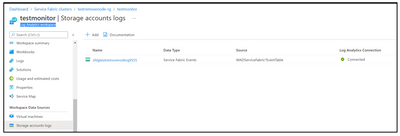
Add the Storage account to Log Analytics workspace where Service Fabric Events are stored which is configured under the VMSS.
Step 5:
Select the resource ServiceFabric(testmonitor)
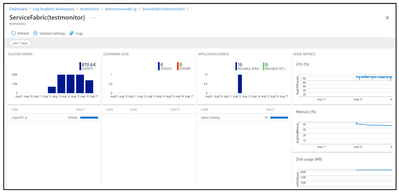
In Overview you see tiles in the form of a graph for each of the solutions enabled, including one for Service Fabric. Click the Service Fabric graph to continue to the Service Fabric Analytics solution.
The following image shows the home page of the Service Fabric Analytics solution. This home page provides a snapshot view of what's happening in your cluster.
Please refer to below article for the useful Kusto queries for events like: Node down, Node Up or Application Health events etc.,
To View the Performance counters with Azure Monitor logs:
Additionally, you can set up Alert rules on the results obtained to take necessary actions.
Reference: https://docs.microsoft.com/en-us/azure/azure-monitor/alerts/alerts-log


