This post has been republished via RSS; it originally appeared at: New blog articles in Microsoft Tech Community.
Symptom:
The issue came up after the web app has been running for a while (several days), the response time of the site slowly increased. And in the end, the requests failed with timeout.
After we reviewed the memory dump and found out that the issue caused by the sites has many unique URLs requests, please refer to the section below.
Cause:
- The Asp.net application can have a web.config files in each folder, it can help to set the specific configuration for that directory. You can find more details here.
- IIS caches the web.config into the machine memory, this can automatically optimize our code by avoiding unnecessary file IO and XML parsing.
- To process a request, IIS parses the request URL into directory and looks for the file client requested. Such as the request https://gsm.azure.com/subscriptions/1a65e618-edXXXXX/bootstrapMcapi will be parse into ../subscriptions/1a65e618-edXXXXX/bootstrapMcapi under the wwwroot folder.
Considering the above 3 facts, to cache the web.config, IIS will save all those unique directories from the requests into the memory. If the overall URL combinations are too many, the cache size would be huge, and the threads will get hung while trying to delete and update this cache.
How to verify if the site's slowness is caused by this?
If the site has a high rate of unique URL requests, it is suffering from this issue. One of the most common scenarios is that the site has a lot of dynamic generate sections in the URL, such as the unique GUID.
You can check the request's URLs if you have any available logs, but if you don't, you can check from the App Service Web Server Log, and by sending the App Service Web Server Log to the Log Annalistic, we will be able to statistic it. You can check the detailed steps at the bottom of this article.
Solution:
If the site does not have any web.config under the subfolders, we can update the allowSubDirConfig of Applicationhost.config to false to prevent it.
The allowSubDirConfig setting specifies whether IIS looks for Web.config files in content directories lower than the current level. This setting is true by default. If the app has a high number of Unique URLs, IIS will try to look at the web.config file for each URL path and caches this information in an in-memory data structure. When the site has a high number of unique URLs, the app may see slowness due to contention around locks taken to update this in-memory structure used by IIS.
This can be achieved by using the following XDT Transform, create a file named applicationHost.xdt and put it under d:\home\site folder with the below content.
How to check Web Server Log from Log Analytic
As we known, the App service's Web Server Log has the request's URL, we can send those logs to the Log Analytic and do a statistic, then we will get to know if the site has a high rate of unique URL requests. The detailed steps are below:
1. Create a Log Analytics Webspace.
Please provide the subscription, resource group name, region and click create button.
2. Send App Service HTTP Logs to the Log Analytic
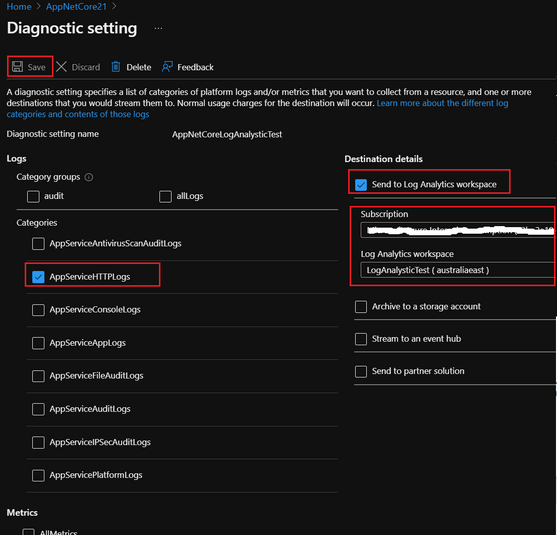
Go to App Service Diagnostic Settings blade, click Add Diagnostic Setting button.
3. Check AppServiceHTTPLogs and Send to Log Analytics workspace
Choose the Log Analytic space we created in the above and save this setting.
4. Check the Request's URL count from the Log Analytic.
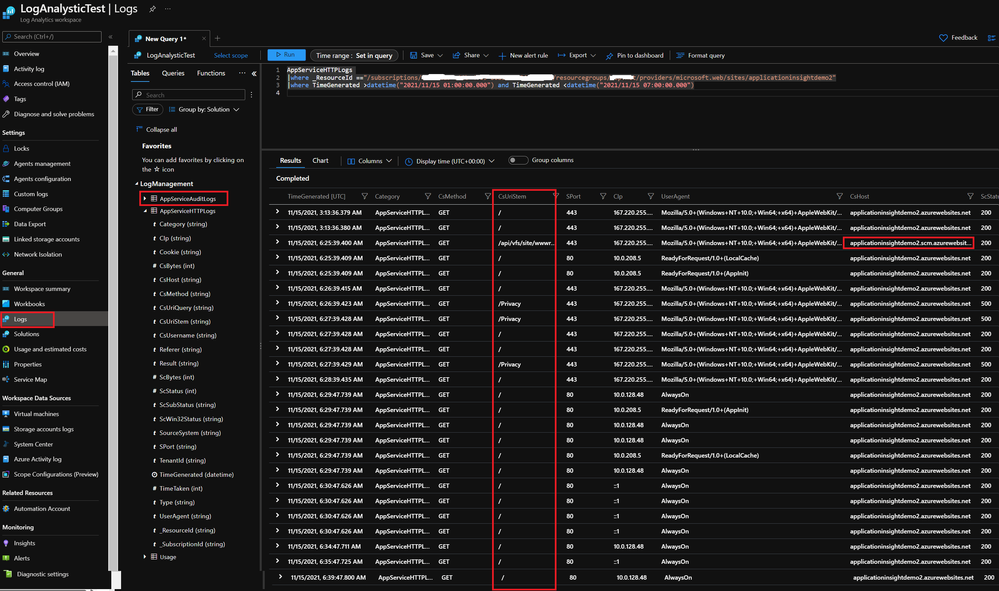
We can check the HTTP request of the web app from the AppServiceHTTPLogs table now. For my test site, I only have a few requests and only 3 kinds of URLs. And one of it is the request to the kudu site.
5. Get the unique URL count:
If we update the query: exclude the Always ON and the scm site's requests, summarize the requests count in every 5 minutes by the URLs, we will get the statistical result of the above requests:
We can also get a diagram if uncommented the last line at bottom of the query. Since I only have a few requests as below, I did not draw a diagram for it.
Please note, the above query gets the total requests count in all the worker instances, if you have multiple worker instance working of the site, this value needs to be divided by the instance count.
We can alter the grain from 5 minutes to 10 minutes, and if the value is huge, such as 4000 for each instance, then site may have such issue.


