This post has been republished via RSS; it originally appeared at: Microsoft Tech Community - Latest Blogs - .
To answer business questions in manufacturing, supply chain, and other domains, customers often need to combine Information Technology (IT) data with Operational Technology (OT) data. This means combining IT data from ERP or CRM systems (e.g., Dynamics 365, SAP, Salesforce) with OT data from IoT devices and production management systems. Given that IT and OT data is often siloed in disparate data stores, it can be a struggle to combine and analyze the data needed to understand the big picture. The result is that some of the most pressing business questions go unanswered, resulting in lost opportunities to improve efficiency and enhance quality.
You can use Azure Digital Twins, Azure Data Explorer, and Azure Synapse to combine IT and OT data to answer pressing business questions. Each service plays the following role:
- Azure Digital Twins contextualizes data from sensors, devices, and systems in the real world.
- Azure Data Explorer supports powerful big data analytics on time series data, including aggregations, anomaly detection, forecasting, and more.
- Azure Synapse Analytics provides a common environment for integrating and analyzing data from 90+ data sources.
You can ingest IT and OT data into a common Synapse workspace as follows:
- IT data ingestion: Synapse provides connectors for a large number of ERP and CRM packages, including Dynamics 365, SAP and Salesforce. Using a connector, you can create a Synapse pipeline to periodically copy data from an ERP or CRM package into a Synapse workspace. For example, you can copy selected tables from an SAP instance into a Lake Database in Synapse.
- OT data ingestion: Azure Data Explorer (ADX) is a highly scalable data analytics service that is well suited for IoT data ingestion and analytics. ADX supports ingestion of IoT data from a variety of sources, including IoT Hub, Event Hub, and Azure Digital Twins via the data history feature. You can link an ADX cluster to your Synapse workspace. This allows you to combine and reason across IT and OT data in the Synapse workspace.
An Example IT/OT Scenario
Alice, a production manager at Vandelay industries, receives a complaint regarding the quality of a batch of widgets shipped to Contoso Inc. (purchase order 300000007). The information needed to investigate the issue is scattered across multiple systems:
- Enterprise Resource Planning (ERP) system (IT data)
- Manufacturing Execution (MES) system (OT data)
- Factory Model + Telemetry (OT data)
Alice decides to ingest the IT and OT data into a Synapse workspace so she can combine and analyze the data to identify the cause of the quality problem. The ingestion data flow is shown below.
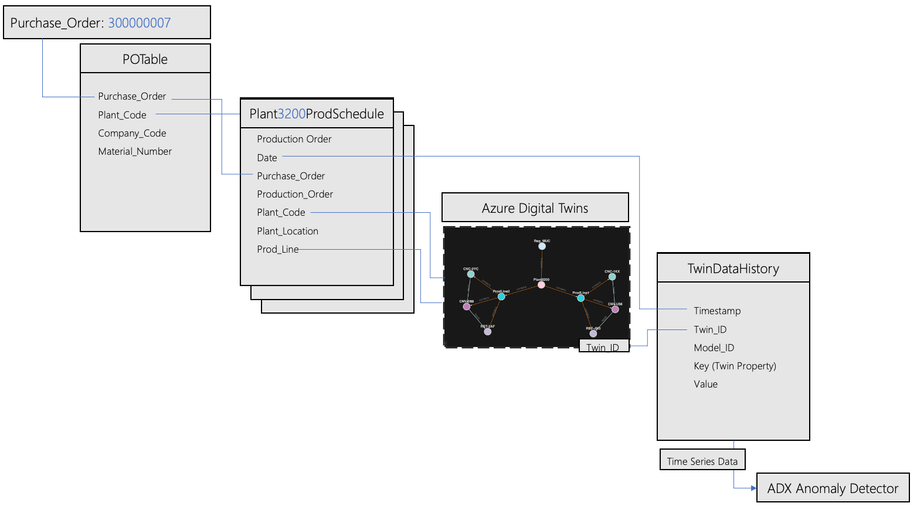
Once the data is available in Synapse, Alice can use the data model below to analyze the sensor data from the stations on the manufacturing line that fulfilled the purchase order (PO).
In Synapse, Alice can query IT and OT data to:
- Look up Purchase_Order 300000046 in the POTable.
- Look up the Production_Order in the production schedule of the plant that fulfilled the PO 300000046.
- Look up the Twin_IDs of the stations on the Mfg_Line that fulfilled the order.
- Analyze the time series sensor data for the Twin_Ids of the stations that fulfilled the PO over a related interval.
Ingesting IT and OT data into Synapse
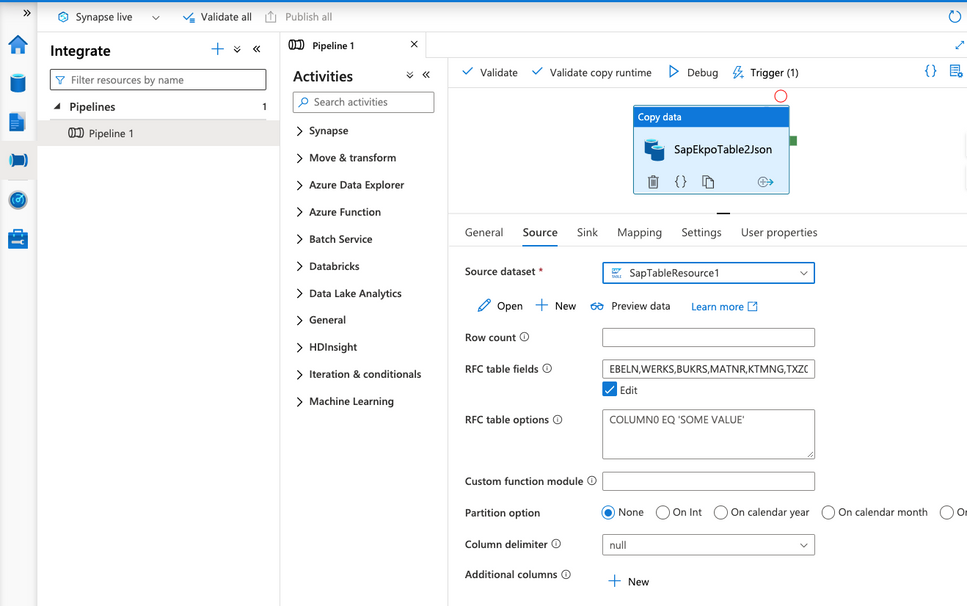
Alice begins by creating a Synapse workspace. She then creates a pipeline to ingest the purchase order table “EKPO” from her SAP system into a JSON file in Azure Data Lake Storage. When creating the pipeline, she defines the SAP table source (shown below)...
...and the Azure Data Lake Storeage Gen2/JSON file sink (shown in the screenshot below).
After testing the pipeline, she runs a SQL script in Synapse to create a view of the PO table in the serverless SQL pool.
She also creates a Synapse pipeline to load Excel production schedule files from various plants into the storage account. She runs the script below to create a production schedule view in the serverless SQL pool.
Alice previously modelled her manufacturing plants in Azure Digital Twins. Below is a twin graph of Plant3200 as visualized in Azure Digital Twins explorer. Each production line in the plant features three stations: a CNC machine (CNC), a conveyor belt (CNV), and a robot (RBT).
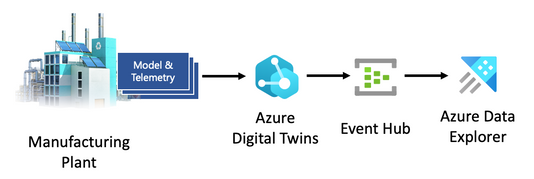
Alice also set up a data history connection to automatically historize twin property updates from each station to an Azure Data Explorer cluster. This provides here with a historical record of the time series behavior of each twin. The data flow is shown below.
She makes the Azure Data Explorer cluster a linked service in her Synapse workspace so the twin history data is accessible along with the other data sets she added previously.
Combining IT and OT data in Synapse
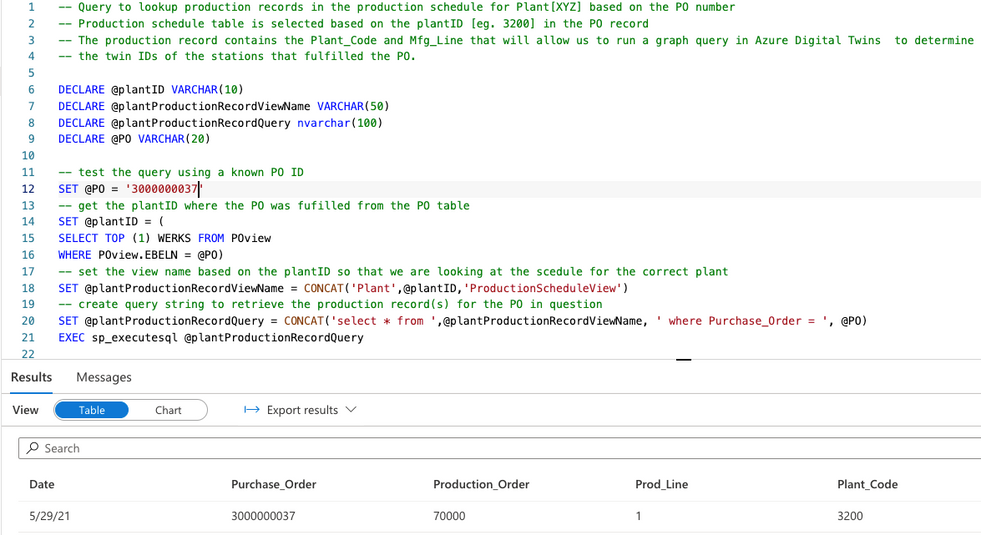
Alice creates a test SQL query in Synapse to look up a production order in a production schedule from the plant that fulfilled the PO. Using the PO number, Alice looks up the Date, the Plant_Code and the Mfg_Line associated with the fulfillment of the purchase order.
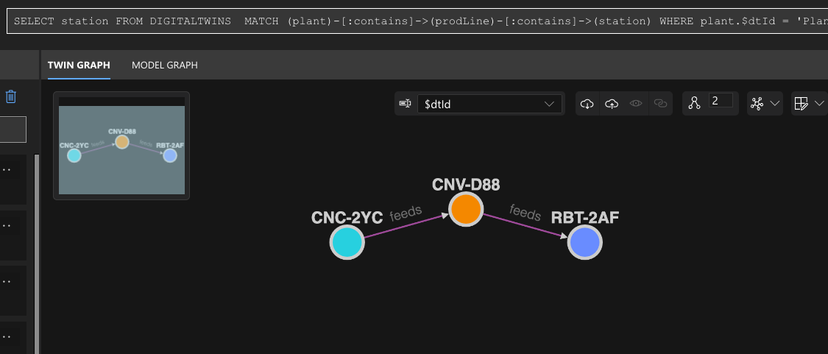
Alice now has the information she needs (Plant_Code, Prod_Line) to query Azure Digital Twins and identify the stations on the manufacturing line that fulfilled the PO. She runs the following query in Azure Digital Twins Explorer.
SELECT station FROM DIGITALTWINS
MATCH (plant)-[:contains]->(prodLine)-[:contains]->(station)
WHERE plant.$dtId = 'Plant3200' AND prodLine.$dtId = 'ProdLine1'
Azure Digital Twins Explorer returns the following result:
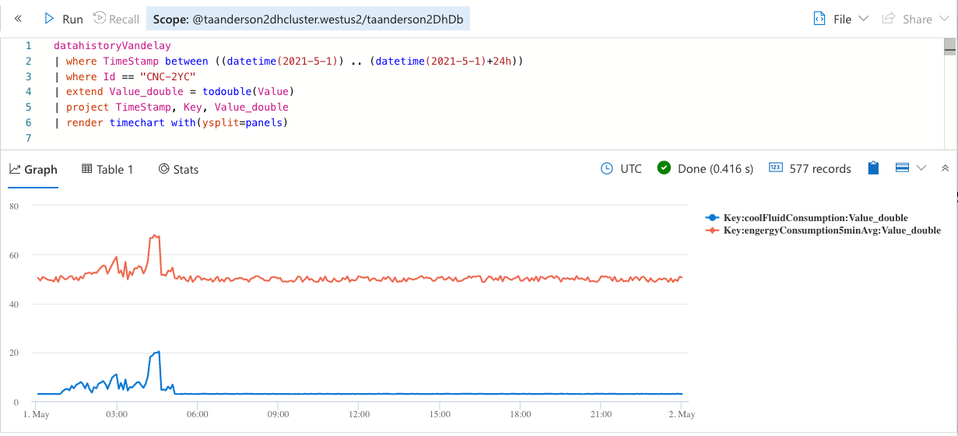
Alice now has the twin IDs of the manufacturing stations (CNC-2YC, CNV-D88, and RBT-2AF) and the date (5/1/21) when the order was manufactured. She can query the twin data history to look for time series anomalies during the time of manufacture. She opens the Azure Data Explorer web UI and looks at the twin data history that was generated by the data history connection.
Then, she charts the data history for the CNC machine twin CNC-2YC at the time of manufacture. Alice sees a spike in both the power consumption and coolant fluid temperature. She now has a lead on the cause of the quality issue associated with the PO.
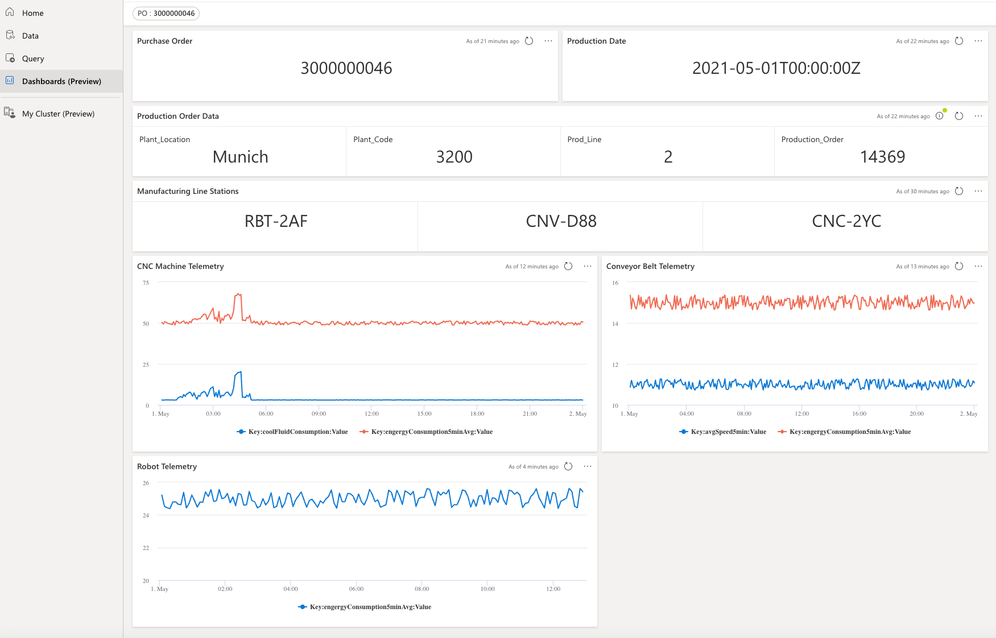
To streamline the investigation process for future inquiries, Alice prototypes a dashboard using the Azure Data Explorer web UI. The dashboard features a dropdown menu to select the PO ID, as well as charts to visualize the telemetry from twins on the line that fulfilled the order during the specified timeframe.
Below is the KQL query that retrieves and renders data for the CNC Machine Telemetry panel. The query runs on the Azure Data Explorer cluster and invokes sub-queries that run on the SQL pool and the Azure Digital Twins instance. The subqueries reflect the SQL queries shown above and accomplish the following steps:
- Assemble a SQL subquery to retrieve the production order associated with the PO selected in the dropdown menu.
- Invoke the SQL query from step 1.
- Assemble an Azure Digital Twins/SQL subquery to retrieve the stations (twins) based on the plant code and production line ID returned by the query run in step 2.
- Invoke the Azure Digital Twins/SQL query from step 3.
- Chart the time series data from the stations on the line that manufactured the order during the production date
// Within the below KQL query, build a SQL query to retrieve the production order associated with the selected PO.  pPO is the parameter set by the drop-down menu.
let SQLquery = strcat(
```
declare @plantID VARCHAR(10)
declare @plantProductionRecordViewName VARCHAR(50)
declare @plantProductionRecordQuery nvarchar(100)
declare @PO VARCHAR(20)
set @PO = '```,pPO,```'
-- get the plantID where the PO was fulfilled
set @plantID = (
SELECT TOP (1) WERKS FROM POview
Where POview.EBELN = @PO)
-- set the view name based on the plantID
set @plantProductionRecordViewName = CONCAT('Plant',@plantID,'ProductionScheduleView')
-- create query string to retrieve the production record of interest
set @plantProductionRecordQuery = CONCAT('SELECT * FROM ',@plantProductionRecordViewName, ' WHERE Purchase_Order = ', @PO)
EXEC sp_executesql @plantProductionRecordQuery```);
let productionOrder = materialize(
    (evaluate sql_request(
        'Server=tcp:<redacted>.sql.azuresynapse.net,1433;'
        'Authentication="Active Directory Integrated";'
        'Initial Catalog=DataExplorationDB;', SQLquery) ));
// Parse the production order returned by the SQL query
let plantID = toscalar (productionOrder | project tostring(Plant_Code));
let lineID = toscalar (productionOrder | project tostring(Prod_Line));
let productionDate = toscalar (productionOrder | project todatetime(Date));
let startDate = productionDate;
let endDate = productionDate + 24h;
// Get twins of interest based on plantID and lineId
let ADTendpoint = "https://<redacted>.api.eus.digitaltwins.azure.net";
let plantDtId = strcat('Plant', plantID);
// Build the ADT-SQL query
let ADTquery = strcat(```SELECT station.$dtId as tid FROM DIGITALTWINS
MATCH (plant)-[:contains]->(prodLine)-[:contains]->(station)
WHERE plant.$dtId = '``` , plantDtId,
"' AND prodLine.productionLineNumber = ", lineID);
// Run the ADT SQL query
let twinIDs = evaluate azure_digital_twins_query_request(ADTendpoint, ADTquery)
// Cast the returned twinIDs as type string (ADT query returns them as a dynamic type)
| extend Id = tostring(tid)
| project-away tid;
// With the data history table, join it against the twinIDs
datahistoryVandelay
| join kind=leftsemi twinIDs on Id
// filter on just the CNC twin for this panel
| where Id startswith "CNC"
| project-away ModelId, Id
| where TimeStamp between (startDate..endDate)
| render timechart
Note that Azure Data Explorer offers connectors for a few popular visualization packages. This means Alice can also implement the above dashboard in Power BI, Grafana, Tableau, or other packages. For a detailed example, check out Creating Dashboards with Azure Digital Twins, Azure Data Explorer and Grafana.
Alternative approaches
This blog shows how to combine and analyze IT and OT data from multiple data sources, and is one of many approaches that can be used. Apache Spark in Azure Synapse Analytics provides another option for managing data when you need parallel processing and in-memory processing to improve the performance of big-data analytic applications. Depending on your use case, you can alternately ingest and analyze IT and OT data entirely within a KQL cluster, using Azure Data Factory to ingest IT data into ADX tables. This latter approach may be useful when a data lake is not required.


