This post has been republished via RSS; it originally appeared at: New blog articles in Microsoft Community Hub.
Correlating Logs in Azure
In this post we'll look at a common scenario; you have a backend application or API which is covered by Application Insights, so you already get plenty of great insight into the application and dependencies, on a per request basis - but what if there's an upstream reverse proxy? Wouldn't it be great to correlate activity in Application insights for a given operation/transaction with the logs for the same request in the upstream reverse proxy?
Three commonly used reverse proxies in Azure are:
Azure API management (APIM) is the easiest in this scenario, this service allows you to integrate with Azure Application Insights and doing so means you now see APIM participate in the end-to-end transaction flow, this should also appear on the Application Map.
The two remaining services, Azure Application Gateway and Azure Front Door do not have Application Insights integration today. So, at first glance it's not so easy to correlate App Insights activity with the App Gateway logs and Front Door Logs.
But all is not lost.
Both services inject a header into the backend request with a unique correlation id value. If you could somehow grab this value in context of the backend application request and add it to the Application Insights Request telemetry (which represents the root of any App insights tracked transaction or operation) then you could very easily obtain the reference to the upstream logs and run an ad-hoc query, or as a stretch goal - construct an Azure Monitor Workbook (a kind of "Living" report) which automates the query , value selection and visualization for end users! And the great thing about Application Insights, with the extensibility possible, this sort of enrichment is VERY straight forwards.
Here's how it can be done.
Application Gateway injects a "x-appgw-trace-id" header.
Front Door inserts an x-azure-ref header.
Both services inject the headers into the requests leaving the service.
We're going to create our own App Insights Telemetry Initializer through the SDK, to enrich telemetry as it leaves the pipeline. This exact same approach could be used, for example, to add a client-ip property from an "x-forward" header and there are a number of other possible applications.
To get going with our initializer we need to create a new class that inherits from "TelemetryInitializerBase" - this will provide the prerequisite plumbing so that we can safely obtain HTTP context which is going to be required in order to access the request headers in which the upstream log file correlation identifiers were injected.
Let's walk through the code above.
We have a class inheriting from the base and overriding "OnInitializeTelemetry". This method will be called "per telemetry" item.
Importantly the DI will ensure that we have a valid HTTP context accessor passed in, which means that in "OnInitializeTelemetry" we get access to the HTT context, as well as the current telemetry and the request root (RequestTelemetry instance).
The class pre-loads a simple collection with the two headers to search for. Header "x-azure-ref" is added by Azure Front Door and contains the transaction correlation reference for the Azure Front Door resource [access] logs. The "x-appgw-trace-id" header does the same thing, but for Application Gateway. If these headers exist, and the access logs are configured through Az Monitor "Diagnostic Settings" (which is really a must, because the Access and WAF firewall logs are important) then we're all good to go!
Application Insights now defaults to writing back to a Log Analytics workspace, for the purposes of this example it makes sense to configure resource logs (the upstream Application Gateway / Azure Front Door Access logs) to be sent to the same Log Analytics Workspace. This simplifies by avoiding a cross workspace query.
So how do we wire that up? Easy. In our dotnet app we instruct the Dependency Injection to add our new Telemetry Initializer as a singleton passing it a HTTP context accessor.
We only want to add the trace id values for Front Door and App Gateway (if we find them) to the RequestTelemetry. We could add them to all telemetry, but it seems wasteful given that all other correlated telemetry in App Insights will be rooted to the RequestTelemetry that initiates the process. Lets have a look at the example implementation of "OnInitializeTelemetry"
After some precautionary null checks, and a quick check to see if we have any headers to search (!) we check the current telemetry is request telemetry, noting there is a chance there could be more than one request telemetry in a transaction flow, out of the box there should always be one. Then, we check the context, http request headers and look for a match. If we find a match, we add the value as a custom property (in this example I named the property after the header for simplicity's sake).
Lets look at those two methods
These are really super simple methods (and I'm equally sure they could be improved on) to find the header value and return it, and to add the custom properties to the RequestTelemetry property bag!
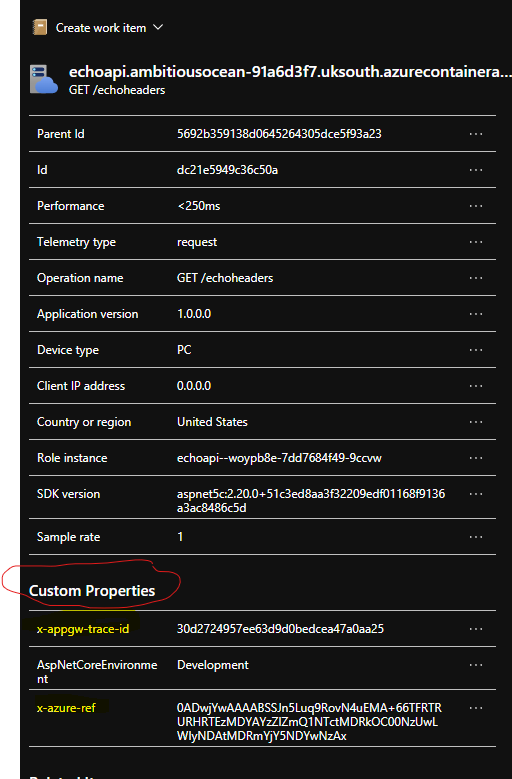
This is what it looks like if you click through the RequestTelemetry in Application Insights
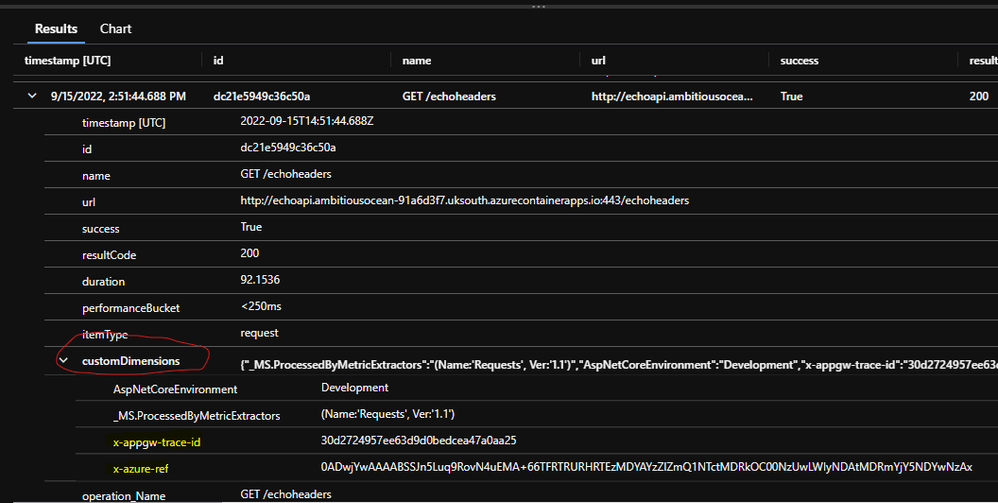
That same telemetry looks like this in the results of a log analytics query for the "requests" or "apprequests" table (from App Insights the table shows as "requests", from Log Analytics as "appRequests" which is the new name).
Let's write a super simple KQL query to grab the data we might be interested in. The Request action and Request duration plus the correlation values for App Gateway and Front Door logs are a good starting point.
Note: Application Insights tables could be named slightly differently if you're accessing them from the "Logs" via the Application Insights resource blade. In the screen snip, I'm working in context of the actual Log Analytics workspace, so the table name is "AppRequests".
In this simple demo I'm referencing an example request telemetry row by its Id field. (The one from the screen snips above).
As an example, we can look into the AzureDiagnostics table for both Application Gateway and Front Door logs. A simple inner join could be used in a workbook to query both the Application Gateway and Azure Front Door Logs in context of the custom fields we've captured. Note that the actual join fields are not the same data type (the App Gateway Id is a guid, the Front Door Id is a string).
We are doing this in order to have a holistic end-to-end view of our request going through the upstream reverse proxy (Azure Front Door and / or Application Gateway) and onto the backend application (or API).
The following query demonstrates joining the logs for Front Door:
Hopefully this short walkthrough inspires you into looking at telemetry in a more holistic fashion across the entire request pipeline of your architecture. This will enhance your understanding of how your applications are performing and aid diagnosis in case of failures.
