
This post has been republished via RSS; it originally appeared at: New blog articles in Microsoft Community Hub.
Authors: Reza Ramezanpour, Dhiraj Sehgal and Tommy Falgout
Cloud computing revolutionized how a business can establish its digital presence. Nowadays, by leveraging cloud features such as scalability, elasticity, and convenience, businesses can deploy, grow, or test an environment in every corner of the world without worrying about building the required infrastructure.
Unlike the traditional model, which was based on notifying the service provider to set up the resources for customers in advance, in an on-demand model, cloud providers implement application programming interfaces (API) that can be used by customers to deploy resources on demand. This allows the customer to access an unlimited amount of resources on-demand and only pay for the resources they use without worrying about the infrastructure setup and deployment complexities.
For example, a load balancer service resource is usually used to expose an endpoint to your clients. Since a cloud provider’s bandwidth might be higher than what your cluster of choice can handle, a huge spike or unplanned growth might cause some issues for your cluster and render your services unresponsive.
To solve this issue, you can utilize the power of proactive monitoring and metrics to find usage patterns and get insight into your system's overall health and performance.
In this hands-on tutorial, I will guide you in enabling Calico metrics to gain insight into the inner workings of your Kubernetes environment and how to connect it to an Azure Managed Grafana instance to convert these metrics into visual dashboards.
The following picture is a simple Grafana dashboard created with Calico metrics:

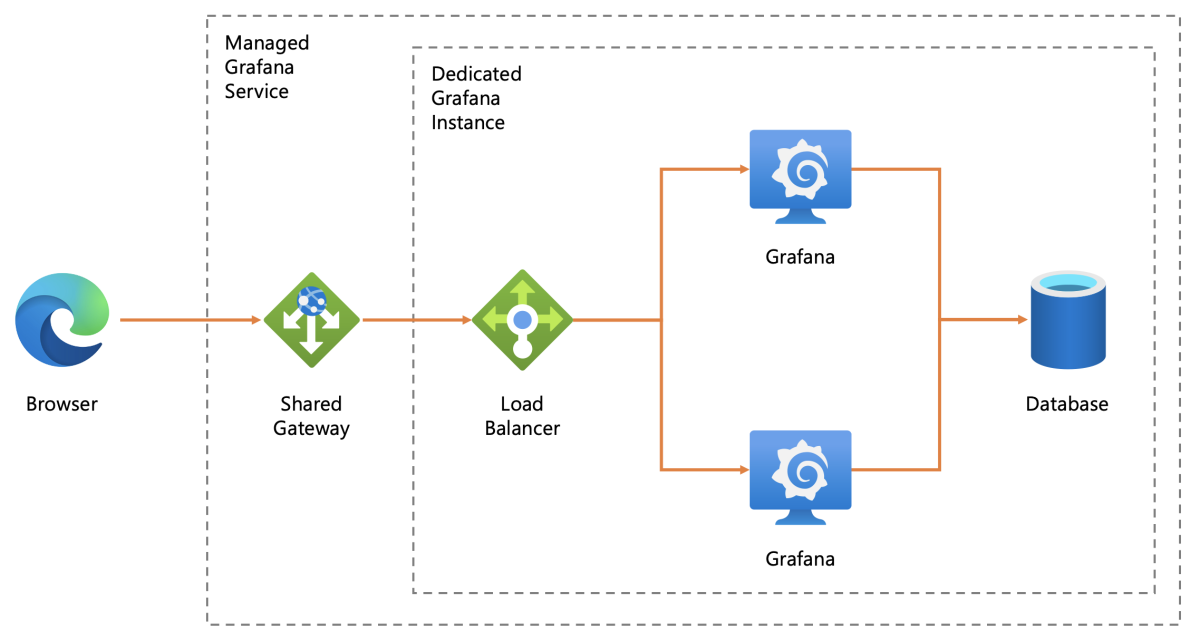
Azure Managed Grafana instances
Azure Managed Grafana is a fully managed service for analytics and monitoring solutions such as Azure Monitor, Jaeger, and Prometheus. It is a quick way to deploy a high-availability monitoring solution that can be used to visualize what is happening inside your Azure environment by accessing information from Azure Monitor and data explorer.
The following image is taken from the Microsoft learning portal, which illustrates the Azure Grafana instance architecture:

Azure Managed Grafana instances are also integrated with your Azure Active Directory users, allowing you to share your dashboards with your colleagues without worrying about additional usernames and passwords.
Each managed Grafana deployment has multiple Grafana instances in an independent environment, which can observe your cloud assets without taking resources from your production environment.
Requirements
If you wish to create your own environment by following this tutorial, make sure you have the following requirements:
- An Azure free or paid account
- Azure Cloud Shell
- A pinch of time (5-10 Minutes)
If you wish to use a local version of Azure CLI, make sure it is 2.30.0 or higher.
The CLI experience for Azure Managed Grafana is part of the `amg` extension for the Azure CLI (version 2.30.0 or higher). The extension will automatically install the first time you run an `az grafana` command.
Note: Azure Managed Grafana instances and AKS clusters are billed independently. If you would like to know more about terms and pricing, visit this link.
At the time of writing, some of the Azure monitoring capabilities are currently in the preview state, which means that we have to configure them manually in order to use them in this tutorial.
Note: Some commands may not work depending on when you read this blog post. If you face any issues, please consider visiting the these tutorials that inspired me to create this post:
- How to create an AKS cluster equipped with Calico
- Azure Bring your own Container Network Interface
- Azure Monitor managed service for Prometheus
- Azure Managed Grafana documentation
Use the following command to `register` AKS-PrometheusAddonPreview in your subscription:
az feature register --namespace Microsoft.ContainerService --name AKS-PrometheusAddonPreview
Once the feature `AKS-PrometheusAddonPreview` is registered, use the following command to get the change propagated throughout your account:
az provider register -n Microsoft.ContainerService
Use the following command to add the `aks-preview` extension to your Azure CLI:
az extension add --name aks-preview
Preparing an AKS cluster for Calico
Authors: Reza Ramezanpour, Dhiraj Sehgal and Tommy Falgout
To run a Kubernetes (or K8s) cluster in Azure, you must create multiple resources that share the same lifespan and assign them to a resource group. A resource group is a way to group related resources in Azure for easier management and accessibility. You can create multiple resource groups with unique names in one location.
Note: Currently, only a handful of locations, such as `eastus`, can be used to create an Azure monitoring workspace.
Use the following command to create a resource group:
az group create --name calico-aks-monitoring --location eastus
Deploying an AKS cluster with Azure-CLI is a simple command execution. However, I would like to provide a quick note on the `network-plugin` and `network-policy` arguments because we will see them a lot throughout this course:
- `Network-plugin` refers to the CNI plugin that will establish networking.
- `Network-policy` refers to the CNI plugin that will enforce the network security policies.
Keep in mind that you cannot change these options after deployment. If you’d like to make changes, your only option is to destroy and redeploy your current cluster from scratch because the Azure control plane will periodically check and re-configure these values.
It is worth mentioning that this tutorial is based on the Azure Bring Your Own CNI (BYOCNI) feature, which is why `network-plugin` in the command below is set as `none`. This option will create an AKS cluster with no pre-installed CNI plugin, which allows you to deploy any third-party CNI plugin that works in Azure.
Use the following command to deploy an AKS cluster:
az aks create --resource-group calico-aks-monitoring --name my-calico-cluster --location eastus --node-count 2 --pod-cidr 192.168.0.0/16 --network-plugin none --generate-ssh-keys --enable-managed-identity
After a successful cluster deployment, we can use `Azure-CLI` to export the cluster identities that `kubectl` needs to communicate with the cluster.
Use the following command to export the cluster config file:
az aks get-credentials --resource-group calico-aks-monitoring --name my-calico-cluster
Great, now it is time to install Calico onto our cluster.
Installing Calico
There are multiple ways to install Calico, such as through manifest and helm. However, the recommended method is to install Calico through the `Tigera-Operator`. Based on the operator framework SDK, the operator is just an application dedicated to ensuring your Calico experience is as smooth as possible.
You can install the operator by executing the following command:
kubectl create -f https://raw.githubusercontent.com/projectcalico/calico/v3.24.1/manifests/tigera-operator.yaml
After a successful deployment, the operator will constantly look for the Calico configuration to set up the CNI and enable its various features depending on your scenario.
For this tutorial, we need to instruct the operator to install Calico as the networking plugin for our cluster and enable the IP address management features of Calico to prevent IP address exhaustion. We will then need to configure an overlay to allow pods that are residing on different nodes to communicate with each other. We also have to set the environment to `AKS` for the `KubernetesProvider` key.
Use the following command to create the configuration:
kubectl create -f https://raw.githubusercontent.com/frozenprocess/azure-managed-grafana/main/01.aks-installation.yml
It may take 1-2 minutes for the Calico installation to finish. Since we are using the Tigera-Operator for our installation, it is possible to query this process by issuing `kubectl get tigerastatus`.
This command is a quick way to gather vital information about the health or status of Calico in a cluster:
kubectl get tigerastatus
It is also possible to pair the `tigerastatus` and `wait` subcommand to instruct kubectl to continuously check the installation status and report back when it is completed.
kubectl wait --timeout 120s --for=condition=Available tigerastatus --all
Enabling Calico metrics
Computer applications are constantly asking for CPU attention to get resource allocations or modify settings in order to accomplish their intended tasks. The number of requests an application sends can give a great insight into the inner workings and health of the application. This information is usually referred to as metrics.
Calico provides a lot of metrics that can be used to let you peek into the inner workings of your cluster and cluster networking.
Use the following command to enable the Calico metrics:
kubectl patch felixconfiguration default --type merge --patch '{"spec":{"prometheusMetricsEnabled": true}}'
Typha metrics
Applications that extend the functionality of Kubernetes need to communicate with the Kubernetes API server to gather crucial information about the cluster and its applications. Calico offers a component called Typha to mitigate the possibility of slowing down in large clusters.
Typha is a caching mechanism for Calico that sits between your Kubernetes datastore and Calico clients to provide a secure way for each Calico client to gather information without putting an additional load on your cluster.
By default, Tigera-Orpeator installs Typha in an operator-based installation, allowing you to take advantage of cloud scalability without worrying about the load on your Kubernetes API server database.
Use the following command to enable Typha metrics:
kubectl patch installation default --type=merge -p '{"spec": {"typhaMetricsPort":9091}}'
Exposing the metrics
Calico uses DaemonSets to deploy `calico-node` pods in each participating node on a cluster. Depending on your cluster size, you might have a different number of `typha-clients` serving your `calico-node` pods. To accommodate such a variable environment, we can use the power of Kubernetes services to create a single entry point that can target all these pods.
Use the following command to create two Cluster-IP services for calico metrics:
kubectl apply -f https://raw.githubusercontent.com/frozenprocess/azure-managed-grafana/main/02.internal-services.yml
Azure Monitoring workspace
Each Azure Monitoring workspace creates an environment for monitoring components to collect their data. These workspaces are comprised of individual repositories, configurations, and permissions.
Use the following command to create an Azure Monitoring workspace:
az resource create --resource-group calico-aks-monitoring --namespace microsoft.monitor --resource-type accounts --name calico-aks-monitoring-users --location eastus --properties {}
After a successful command execution, we must extract the resource's ID from the output. However, depending on your settings, the output might have overwhelming information. Alternatively, you can directly extract the resource ID by using the following command.
az resource show -g calico-aks-monitoring --resource-type accounts -n calico-aks-monitoring-users --namespace microsoft.monitor --query 'id' -o tsv
Make sure to copy the resource path from the previous output, as we are going to need it in the next step. The resource path looks like this:
/subscriptions/<subscription_id>/resourcegroups/calico-aks-monitoring/providers/microsoft.monitor/accounts/calico-aks-monitoring-users
Azure Container insights
Azure container insights provide an elegant way to monitor the performance of container workloads that are deployed in the Azure cloud platform.
Azure Container insights create deployments and DaemonSets to collect metrics from a Kubernetes environment. After the metrics are collected, they are sent to the metrics database in Azure Monitor. It is also possible to share these records by associating external resources with the Azure Monitoring workspace.
The following image illustrates the Container insights architecture:

Note: Change the <YOUR-RESOURCE-PATH> with the one that you acquired from the previous step.
Use the following command to enable azure container insights for your cluster:
az aks update --enable-azuremonitormetrics --resource-group calico-aks-monitoring --name my-calico-cluster --azure-monitor-workspace-resource-id <YOUR-RESOURCE-PATH>
After a successful installation, you should be able to query `ama-metrics`, `ama-metrics-ksm` deployments, and `ama-metrics-node` DaemonSet.
Integrating Calico metrics with the Azure Container insights
By default, Azure Container insights collectors are tuned to collect general data about the Kubernetes and node components. In addition to the default scrape targets that the Azure Monitor Prometheus agent scrapes by default, it is possible to create additional scrape targets and add them to the Azure Container insight process.
For example, we can create an `ama-metrics-prometheus-config` configmap in the `kube-system` namespace and add a valid Prometheus configuration syntax to it to instruct the Azure Container insight to scrape the Calico metrics and add it to its database.
Use the following command to add Calico metrics to Azure Container collection jobs:
kubectl create -f https://raw.githubusercontent.com/frozenprocess/azure-managed-grafana/main/03.prometheus-config.yml
Container insights will periodically search for a `prometheus-config` file to merge it with its configurations, but to speed up the process, let’s manually restart the `ama-metrics` deployment. Do note that this is not recommended for a production environment.
kubectl rollout restart -n kube-system deployment/ama-metrics
Use the following command to verify that Felix metrics are now exported by the ama-metrics Prometheus.
kubectl logs -n kube-system deployment/ama-metrics prometheus-collector| egrep 'scrape config for'
You should see an output similar to the following:
prometheus-config-merger:: Successfully set label limits in custom scrape config for job felix_metrics
prometheus-config-merger:: Successfully set label limits in custom scrape config for job typha_metrics
prometheus-config-merger:: Successfully set label limits in custom scrape config for job kube_controllers_metrics
Perfect! Azure Container insight is now scraping Calico metrics.
Grafana: Visualization
Let’s use the Azure-CLI to deploy a fully redundant Grafana instance with an Active Directory authentication backend.
There are a few things that you need to consider when naming an Azure Grafana Instance.
- Instance name will be used as the domain name in your Managed Grafana instance URL and should be unique.
- The name must be between 2 to 30 characters long.
- Each name should begin with a letter and end with a letter or digit.
Note: Change the <YOUR_GRAFANA_INSTANCE_NAME> with a name you desire that follows the previous rules.
Use the following command to create an environment variable to hold the Grafana instance name, which will be used in the coming steps:
GRAFANA_NAME=<YOUR_GRAFANA_INSTANCE_NAME>
Use the following command to deploy a managed Grafana instance into your Azure account: '
az grafana create --name $GRAFANA_NAME --resource-group calico-aks-monitoring --location eastus
Note: The following prompt might show up the first time you try to deploy a managed Grafana instance. Choose Y to proceed:
The command requires the extension amg. Do you want to install it now? The command will continue to run after the extension is installed. (Y/n):
Linked Grafana workspaces
If you recall, I mentioned that external resources could access stored insights metrics when they are part of the same monitoring workspace. Since Grafana-managed instances are external resources, we can use this feature to link them with the monitoring workspace and allow it to access the recorded metrics securely.
Open up the Microsoft Azure portal and browse Azure resources. Click on `calico-aks-monitoring-users` that we created earlier and choose the linked Grafana workspaces from the sidebar menu. After that, click on Link, and in the popup menu, choose the name you assigned for your Grafana instance in the previous step and submit the change.
Note: Changes in this step may take 30-60 seconds to take effect.
The following picture illustrates the steps you must go through to link a managed Grafana instance with the Grafana workspace:

Visualizing the data
When Grafana and the monitoring workspace are linked together, we can instruct Grafana to access the metrics that are stored in the monitoring workspace database and visualize it by utilizing the power of Grafana charts.
Use the following command to download the latest Felix dashboard file:
curl -OL https://raw.githubusercontent.com/frozenprocess/azure-managed-grafana/main/04.felix-dashboard.json
Use the following command to create a dashboard that visualizes Felix metrics (Felix is the brain behind Calico) from the file that you downloaded earlier:
az grafana dashboard create -g calico-aks-monitoring -n $GRAFANA_NAME --title "Felix Dashboard" --definition 04.felix-dashboard.json
Use the following command to download the latest Typha dashboard file:
`curl -OL https://raw.githubusercontent.com/frozenprocess/azure-managed-grafana/main/05.typha-dashboard.json`
Use the following command to create a dashboard that visualizes Typha metrics from the file that you downloaded earlier:
az grafana dashboard create -g calico-aks-monitoring -n $GRAFANA_NAME --title "Typha Dashboard" --definition 05.typha-dashboard.json
Grafana Dashboard
Now, it’s finally time to switch gears and check out the dashboard that we just created.
Use the following command to get the Grafana dashboard URL:
az grafana show -n $GRAFANA_NAME --query "properties.endpoint" -o tsv
You should see a similar result:
https://managed-grafana-ezgqddfhhqd8g6h4.wcus.grafana.azure.com
Note: Managed Grafana instances are linked to your Azure Active Directory users. You can use your Azure username and password to log in to your dashboard.
Use the URL to access Grafana. It is important to note that each environment is different, and these visualizations are just a proof of concept, so feel free to use these metrics to create a customized dashboard that can serve your environment.
The following picture illustrates the Grafana dashboards that you will encounter in your managed Grafana instance:

Since Azure container insights are configured for this cluster, and the managed Grafana instance is integrated with our Azure Active Directory Identities, as a bonus, we should be able to use the Microsoft Azure Monitor and Managed Prometheus dashboards to gather information about the current Azure and Kubernetes resources.
Clean up
Use the following command to delete the AKS cluster:
az group delete --name calico-aks-monitoring
Use the following command to delete the `managed-grafana instance` that was created in this tutorial.
az grafana delete -n managed-grafana
Conclusion
In this post, we’ve explored how to use Calico features such as IPAM and performance metrics to gain more value from an AKS cluster, but this is a fraction of Calico’s power. Calico also offers a pluggable dataplane approach and implements eBPF and Linux iptables for Linux environments, as well as Host Network Service or HNS for Windows environments. This modular architecture makes Calico a great choice for any environment and gives you the required tools to be in charge of your data.
Ready to become an Azure expert? Enroll in the Calico Azure course now.