This post has been republished via RSS; it originally appeared at: New blog articles in Microsoft Community Hub.
Blog Post Contributors: Rohitha Hewawasam (Principal Software Engineering Manager), Kent Weare (Principal Product Manager)
Being able to gain insights into the health and performance of your workflows is an important operations activity. Recently, we have updated Azure Logic Apps (Standard) to provide in-product metrics that help customers monitor the health and performance of their workflows.
Locating Metrics
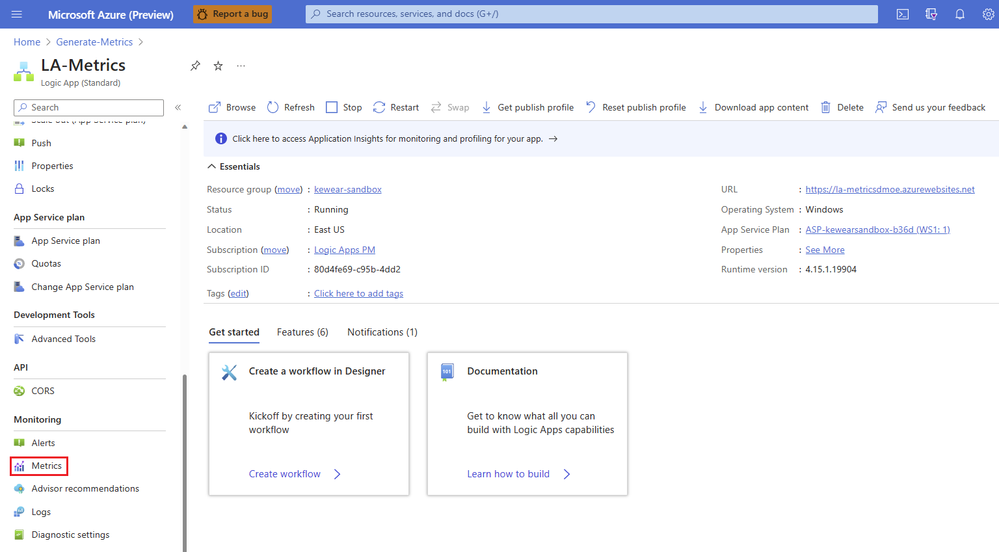
Metrics are enabled automatically and can be located in the left navigation panel within the Monitoring section.
From within this list, we will find the following metrics available:
- Workflow Action Completed Count: The number of actions completed, regardless of status.
- Workflow Job Execution Delay: The amount of time between when a job was scheduled to run and when the job actually ran.
- Workflow Job Execution Duration: The amount of time a job took to complete its execution.
- Workflow Runs Completed Count: The number of workflow executions completed, regardless of status.
- Workflow Runs dispatched Count: The number of previously queued requests that are now processed.
- Workflow Runs Started Count: The number of workflows started, regardless of outcome status.
- Workflow Triggers Completed Count: The number of triggers completed, regardless of outcome.
When these metrics are used within a query, the results will include data from all workflows within the Logic App. However, we can also use filters that allow us to restrict results based upon a workflow name or status. Please see the sample scenario outlined below for more details on this capability.
Note: Within the Metric dropdown, you may discover other metrics that aren’t related to workflows. Additional App Service metrics are also available for your evaluation. To learn more about these metrics, please refer to the following documentation.
With a Metric selected, we can now choose an Aggregation including:
- Count
- Avg
- Min
- Max
- Sum
Sample Scenario
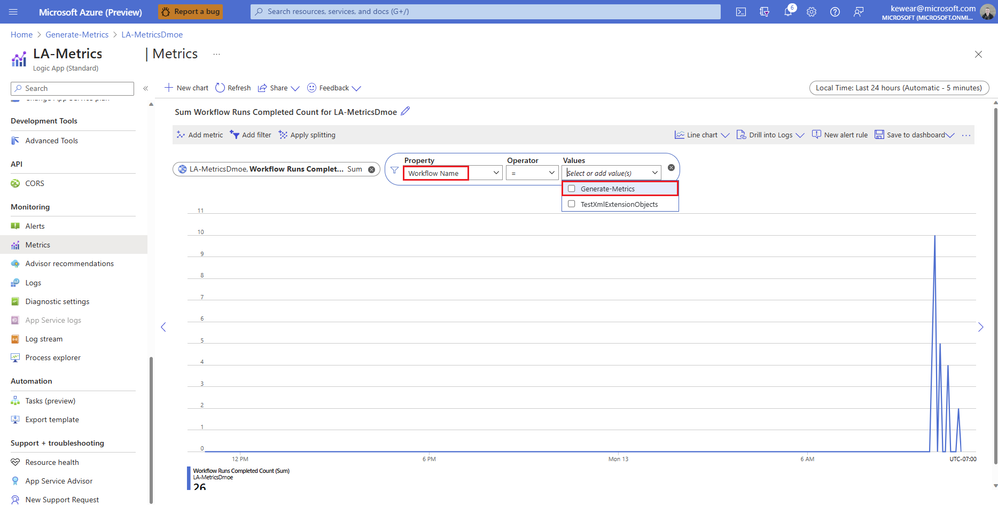
Suppose we want to see the count of a specific workflow over the past 24 hours, based on a particular status. To achieve this, we can start by selecting the Workflow Run Complete Metric and then select Sum as our Aggregation.
Since we may have more than 1 workflow running within our Logic App instance, we can filter results by clicking on the Add filter button, selecting Workflow Name from the Property drop down and then selecting our workflow from the Values dropdown menu.
If we want to further restrict our results to executions with a specific status (Succeeded/Failed) we can accomplish this by adding an additional filter for Status.
If you would like to see a video version of this content, please check out the following YouTube video. In addition, please check out our product documentation for additional details.


