This post has been republished via RSS; it originally appeared at: New blog articles in Microsoft Community Hub.
Recently, we assisted a customer who was facing slowness issues with their classic ASP web application. However, we encountered some unusual behavior. Despite detecting a slowdown of over 15 seconds in the IIS logs, the Failed Request Tracing logs did not generate any data for the "Time taken" field. To identify the root cause of the issue, we collected Perfview ETW for the classic ASP application, allowing us to load all the events and identify the modules and events that were taking the longest time to load during the problem.
Here are the steps we followed :
- Please install the Perfview tool from https://github.com/Microsoft/perfview/releases
- Open the Perfview tool on the server by running it as an Administrator.
- Go to Collect Menu and select Collect option.
- In the dialog box that opens, Select Zip, Merge, thread time check boxes.
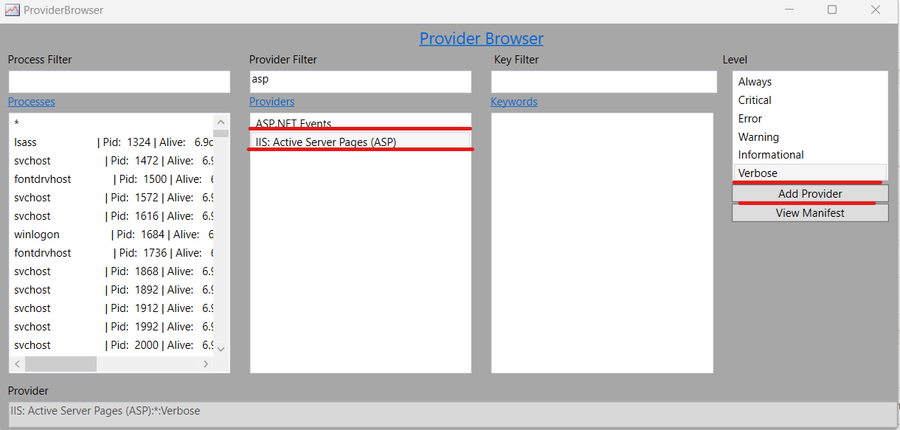
- Expand the Advanced Options tab and select IIS checkbox.
- Again, click on the “Provider Browser” and choose the
- Now, click on the “Start Collection” button.
- Run your application.
- Once the application has finished loading up, stop the collection by clicking on the Stop Collection Button in Perfview.
- Let the etl file get merged to a zip file.(A pop will come asking which symbols you want to use ,choose "Microsoft Symbols")
- Upload the zip file generated, to the workspace provided to you.
Note: Do not run this trace for more than 1-2 minutes:
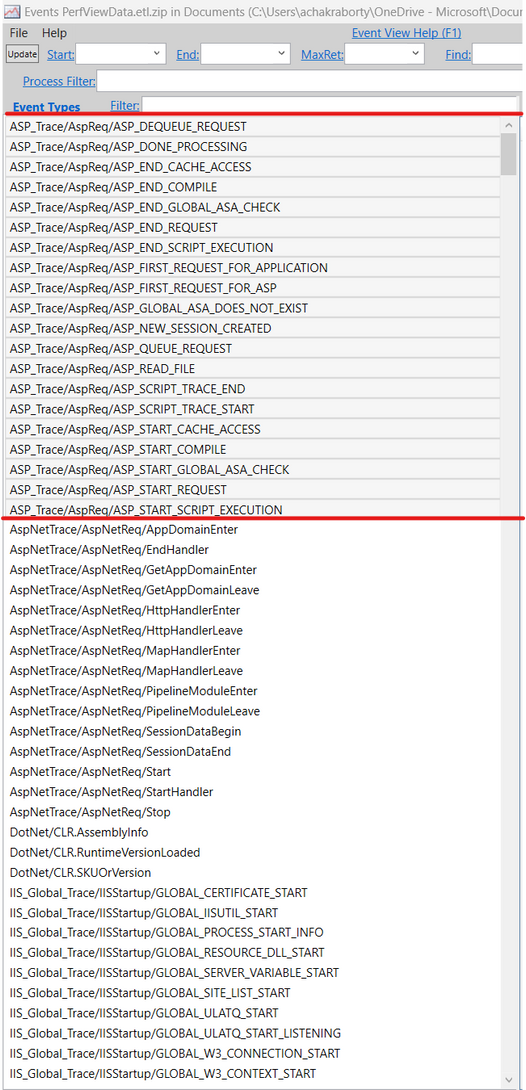
Once we open the events section of the perfview we could see these ASP events are captured :
Once we open the above-highlighted events, we could see much more detailed information about the requests :
In case , we are not able to capture the etw via the perfview UI , then we could use the command line as well :
- Run the command prompt as an Administrator and navigate to the file path where you have stored the perfview.exe
- Run this command :
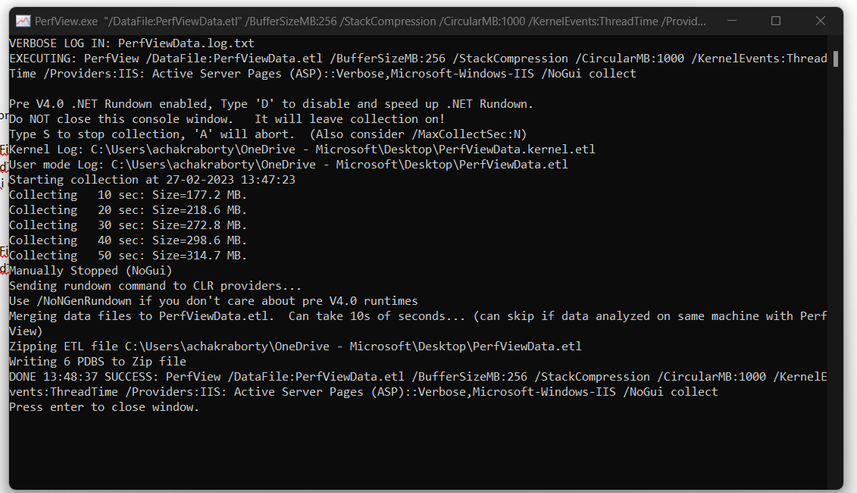
PerfView.exe "/DataFile:PerfViewData.etl" /BufferSizeMB:256 /StackCompression /CircularMB:1000 /KernelEvents:ThreadTime /Providers:"IIS: Active Server Pages (ASP)::Verbose,Microsoft-Windows-IIS" /NoGui collect - Once the command starts, you would notice a separate command prompt window opening up and it would look like this :
- Once the log collection has started, please replicate the issue and then you can just type “s” to manually stop the capture, and then you would notice that it is automatically merging and zipping the file for you in the same location where we have the exe.
- You have to open the events section again, to check for all the Asp events for the request.
-
Happy Troubleshooting :smiling_face_with_smiling_eyes:


