Lesson Learned #337: HADR_SYNC_COMMIT wait type delay in Azure SQL Database

This post has been republished via RSS; it originally appeared at: Azure Database Support Blog articles.

Today, I worked on a service request that our customer faced a performance issue in their business critical service tier database. Their main suspect was that the syncronization with the secondary replica has a delay. 


During their troubleshooting process they found that they got many request with the wait type is HADR_SYNC_COMMIT. This wait type indicates the time that the primary replica spends waiting for the sconedary replica to harden the log records (LSN). This wait type only occurs on the primary replica and only inside a synchronous replication that we could have for every internal replica when we created a business critical or premium service tier database. 


As soon as a transaction is received in the primary replica and it sends to the secondary replica for hardering, the wait type HADR_SYNC_COMMIT wait time starts counting the time until receiving the confirmation for the secondary's transaction log was completed. 


Following, I would like to share with you how is possible to reproduce this and how is posible to know the latency. 


I created this table including the option OPTIMIZE_FOR_SEQUENTIAL_KEY=ON for improvements when we are adding incremental values.


CREATE TABLE [MSxyzTest].[_x_y_z_MS_HighLogIO]( [DataInsert] [nvarchar](max) NULL, [ID] [int] IDENTITY(1,1) NOT NULL, CONSTRAINT [PK__x_y_z_MS_HighLogIO] PRIMARY KEY CLUSTERED ( [ID] ASC )WITH (STATISTICS_NORECOMPUTE = OFF, IGNORE_DUP_KEY = OFF, OPTIMIZE_FOR_SEQUENTIAL_KEY = ON) ON [PRIMARY] ) ON [PRIMARY] TEXTIMAGE_ON [PRIMARY] GO


In order to reproduce a high number of transactions, I developed the following store procedure:


CREATE OR ALTER Procedure RunATest as DECLARE @TOP AS INT DECLARE @TSQL AS VARCHAR(4000) SET @TOP = CEILING(RAND()*(1-180)+180) SET @TSQL = 'INSERT INTO [MSxyzTest].[_x_y_z_MS_HighLogIO] (dataInsert)' SET @TSQL = @TSQL + 'values(replicate(CONVERT(NVARCHAR(4000),' SET @TSQL = @TSQL + CHAR(39) + 'M' + CHAR(39)+ '),4000))' exec (@tsql)


Finally, using the tool oStress, we are going to run 798 concurrent process (my business critical has 8 vCores and 800 workers limit) the store procedure 10000 times. 


"C:\Program Files\Microsoft Corporation\RMLUtils\ostress.exe" -dddbb -Q"EXEC dbo.RunaTest" -Sservername.database.windows.net -Uusername -n798 -r10000 -q -l60 -Ppassword


Running this process we could see the first HADR_SYNC_COMMIT using the following query:


select req.wait_resource as Resource, req.status, tasks.session_id, task_state, wait_type, wait_time, req.last_wait_type, cpu_time, dop, req.command, blocking_session_id, substring (REPLACE (REPLACE (SUBSTRING (ST.text , (req.statement_start_offset/2) + 1 , ( (CASE statement_end_offset WHEN -1 THEN DATALENGTH(ST.text) ELSE req.statement_end_offset END - req.statement_start_offset)/2) + 1) , CHAR(10), ' '), CHAR(13), ' '), 1, 512) AS statement_text, sched.status, * from sys.dm_exec_requests req join sys.dm_os_workers work on req.task_address = work.task_address join sys.dm_os_tasks tasks on req.session_id = tasks.session_id join sys.dm_os_schedulers sched on sched.scheduler_id = tasks.scheduler_id CROSS APPLY sys.dm_exec_sql_text(req.sql_handle) as ST where req.status <> 'background' and req.session_id<> @@spid AND req.wait_type LIKE 'HADR_SYNC%' order by wait_resource,req.session_id, req.status


For every execution we could see, in the following image, that gave us, as an example, the latency per request.


Jose_Manuel_Jurado_0-1679685561306.png


Also, using the following query:


select * from sys.dm_os_wait_stats where wait_type = 'HADR_SYNC_COMMIT'


Jose_Manuel_Jurado_0-1679685706472.png


The Waiting Task Count column give us the number of single transactions done until now, if we divide by wait_time_ms migh give us the milliseconds in average that took for syncronization for secondary. In this case, 676004/372743 = 1.8 milliseconds. 


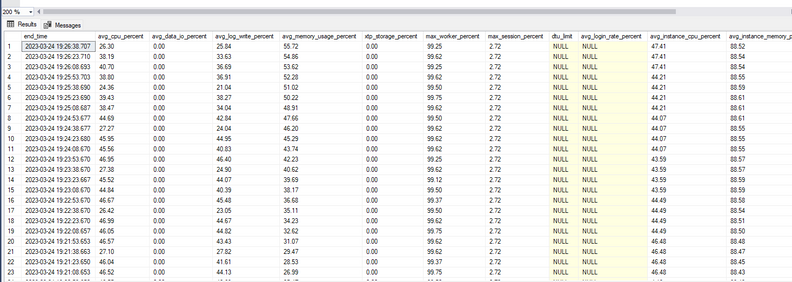
Finally, our customer asked if could be possible to have information about CPU, IO and workers used. We replied that using the query SELECT * FROM SYS.DM_DB_RESOURCE_STATS you could have the following information:


Jose_Manuel_Jurado_1-1679686078268.png


Enjoy!

Leave a Reply

Your email address will not be published. Required fields are marked *

*

This site uses Akismet to reduce spam. Learn how your comment data is processed.