This post has been republished via RSS; it originally appeared at: Microsoft Tech Community - Latest Blogs - .
When you're developing and running web applications, things don't always go as planned. You might encounter errors, underperforming response times, or unexpected behavior. The Azure App Service Diagnostics Logging capabilities come to the rescue in such situations. By enabling the application logging features, you can quickly and easily view your application logs to diagnose and fix issues.
Here are a few examples of the types of problems you can solve by consulting your application logs:
- Errors: When an error occurs in your application, it's important to understand what went wrong and where. By consulting your application logs, you can see the error message and any relevant details, such as the stack trace. This can help you pinpoint the issue and fix it more quickly.
- Performance issues: If your application is slow to respond, you can use your logs to identify bottlenecks and areas where you can optimize your code. For example, you might notice that a certain API call is taking longer than expected or that a particular query is causing slow database performance.
- Security issues: By analyzing your application logs, you can identify potential security issues, such as failed login attempts or suspicious activity. This can help you take proactive steps to secure your application before a breach occurs.
It's important to note that App Service Logs are disabled by default in Azure App Service. This means that you need to enable the feature before you can start collecting logs. If you don't enable logging, your application logs will not persist, and you won't be able to consult the same when troubleshooting issues.
Enabling and Streaming App Service Logs
Windows Web Apps
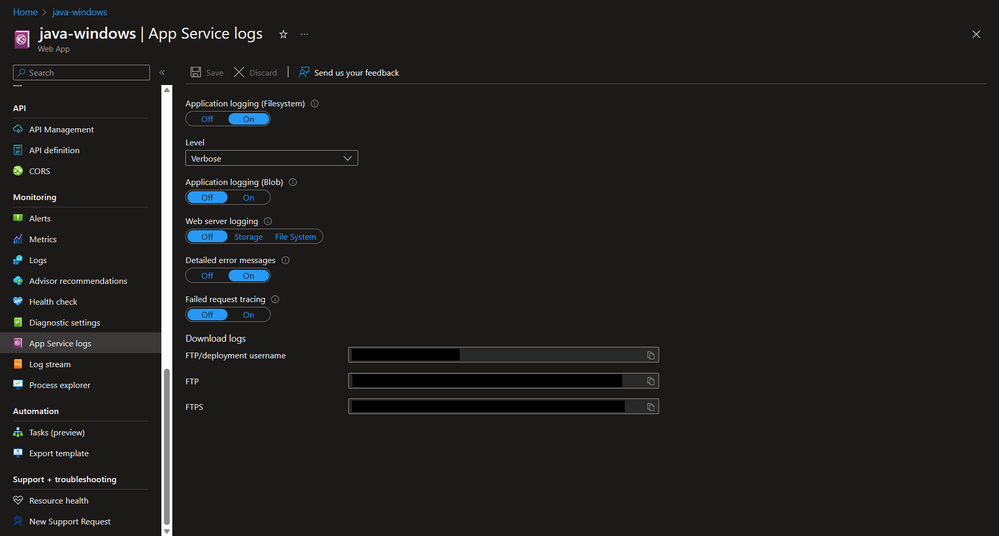
To enable App Service Logs for a Windows Web App, follow these simple steps:
- Navigate to your Windows Web App and select the "App Service Logs" option under the "Monitoring" section in the left pane.
- Toggle the "Application Logging (Filesystem)" option to On, and optionally set the log level to the desired verbosity level. You may enable other logging options as needed (further information regarding the same is available at our documentation page: Enable diagnostics logging - Azure App Service | Microsoft Learn)
- Click "Save" to enable the feature.
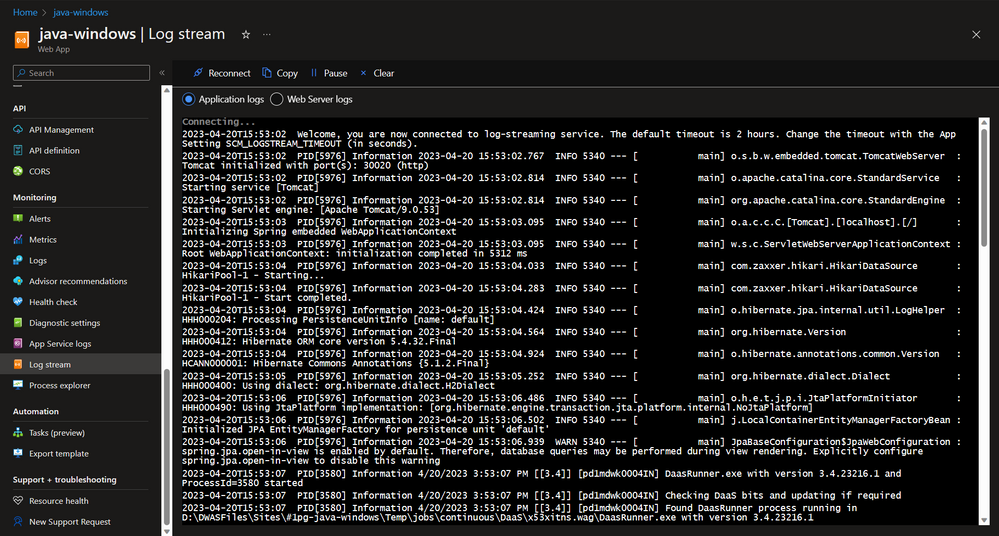
Once you have enabled App Service Logs, you can view the logs in the Azure portal. Simply navigate to the "Log stream" section under "Monitoring" and you'll be able to see your application logs in real-time:
Linux Web Apps
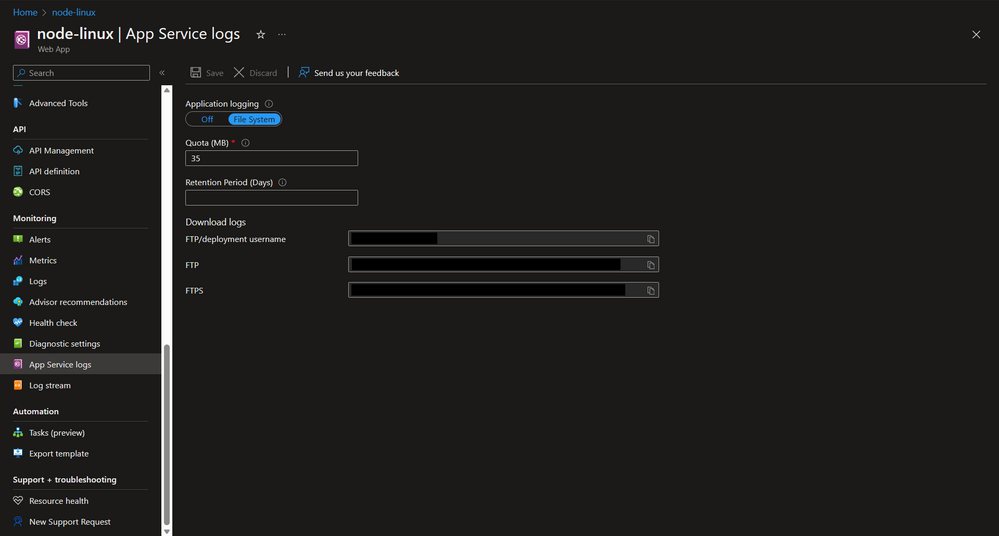
To enable App Service Logs and Log Stream for a Linux web app in Azure, follow these simple steps:
- Navigate to your Linux Web App and select the "App Service Logs" option under the "Monitoring" section in the left pane.
- Toggle the "Application Logging" button to "File System", and optionally change the "Quota" and "Retention Period" as desired
- Click "Save" to enable the feature.
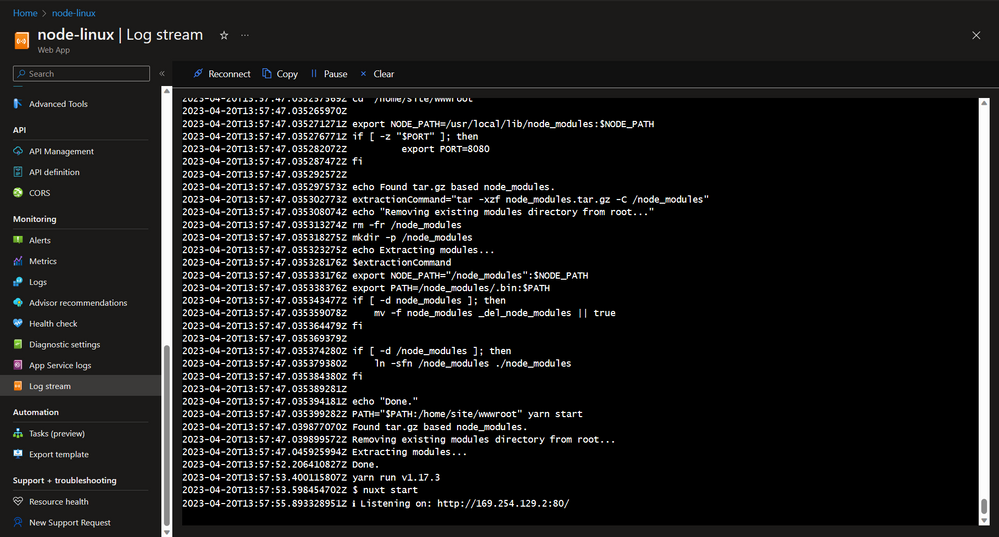
Once you have enabled App Service Logs, you can view the logs in the Azure portal. Simply navigate to the "Log stream" section under "Monitoring" and you'll be able to see your application logs in real-time:
Downloading App Service Logs
Once you have enabled logging for your Azure App Service, you can easily download the log files to your local machine. This can be useful for sharing logs with other team members or for offline analysis. To download a zip file containing the log files, simply replace my-webapp your Web App name on the following URL, and open the same: http://my-webapp.scm.azurewebsites.net/api/dump
This will start the download of the dump.zip file, which then contains the LogFiles directory.
Windows Web Apps
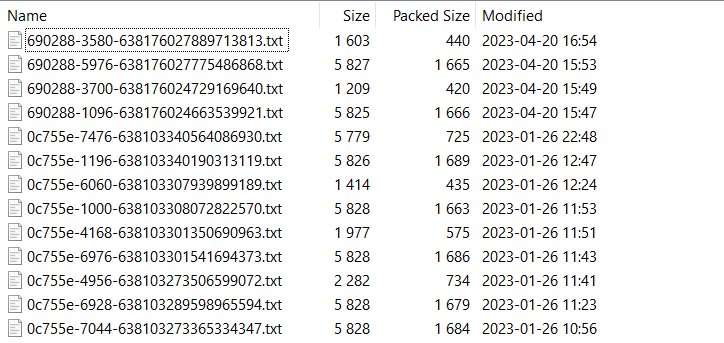
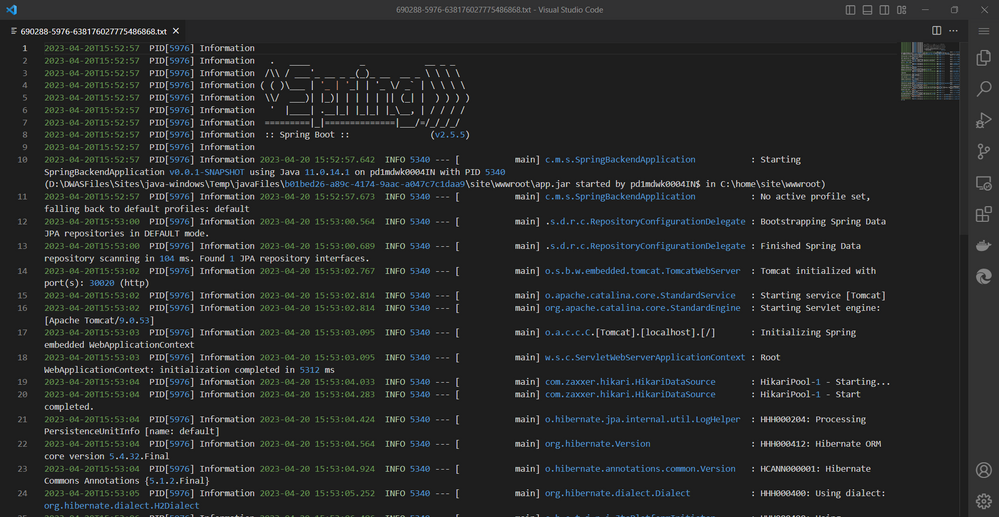
On Windows, inside the LogFiles directory you will have several other directories for each of the logging capabilites previously enabled:

The Application directory will contain the logs rendered by your application:
Linux Web Apps
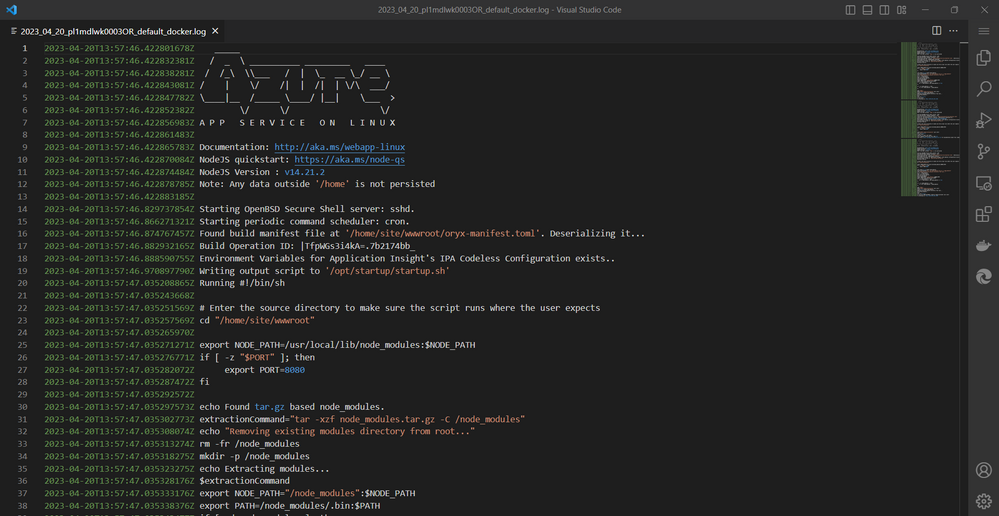
On Linux Web Apps, inside the LogFiles directory you will have two types of log files with two different formats. The files with the format date_instance_docker.log contain information regarding platform processes. The files with the format date_instance_default_docker.log contain the logs rendered by your application:

Logging Best Practices
Enabling logging for your application is just the first step towards maintaining its health and performance. Proper logging is essential to ensure that your logs are useful and cost-effective. Here are a few best practices that you should keep in mind:
- Log only what's necessary: Logging can be resource-intensive, so it’s important to only log what’s necessary. On the opposite, not logging enough information can make it difficult to diagnose issues when they occur. It’s important to strike a balance between logging too much and not logging enough.
- Avoid logging sensitive information such as passwords or other personally identifiable information (PII).
- Use a structured logging format: Structured logs are easier to search and analyze than unstructured logs. Consider using a structured logging format such as JSON or XML.
- Include context information: When logging errors or other events, include relevant context information such as the user ID or the API endpoint that was accessed. This can make it easier to diagnose issues.
- Use log levels appropriately: Use log levels such as "Debug", "Info", "Warning", and "Error" appropriately to ensure that you're capturing the right level of detail in your logs.
Below are a few examples of how you can configure logging for different application languages, using built-in or external logging libraries:
.NET Core: In your appsettings.json file, you can configure logging settings such as the log level and log file path. For more information please consult the following page: Logging in .NET Core and ASP.NET Core | Microsoft Learn
{
  "Logging": {
    "LogLevel": {
      "Default": "Information",
      "Microsoft": "Warning",
      "Microsoft.Hosting.Lifetime": "Information"
    },
    "File": {
      "Path": "logs/app.log",
      "Append": true,
      "MaxFileSize": 10485760,
      "RollingInterval": "Day",
      "RollingStyle": "SizeAndAge"
    }
  }
}
Node.js: Use a logging library such as Winston or Bunyan to configure logging settings and output to a file or console. Here's an example configuration for logging to a file using Winston, for more information please consult the following page: winstonjs/winston: A logger for just about everything. (github.com)
const winston = require('winston');

const logger = winston.createLogger({
  level: 'info',
  format: winston.format.json(),
  transports: [
    new winston.transports.File({ filename: 'logs/app.log' })
  ]
});

logger.info('Hello, Winston!');
Python: Use a logging library such as Python's built-in logging module or loguru to configure logging settings and output to a file or console. Here's an example configuration for logging to a file using Python's logging module, for more information please consult the following page: logging — Logging facility for Python — Python 3.11.3 documentation
import logging

logging.basicConfig(filename='logs/app.log', level=logging.INFO)

logging.info('Hello, logging!')
Java: Use a logging framework such as Log4j or Logback to configure logging settings and output to a file or console. Here's an example configuration for logging to a file using Log4j, for more information please consult the following page: Log4j – Configuring Log4j 2 (apache.org)
import org.apache.logging.log4j.LogManager;
import org.apache.logging.log4j.Logger;

public class MyApp {
  private static final Logger logger = LogManager.getLogger(MyApp.class);

  public static void main(String[] args) {
    logger.info("Hello, Log4j!");
  }
}
PHP: Use a logging library such as PHP's built-in logging module or Monolog to configure logging settings and output to a file or console. Here's an example configuration for logging to a file using PHP's error_log module, for more information please consult the following page: PHP: error_log - Manual
<?php
// Configure error logging in php.ini
ini_set('log_errors', 'On');
ini_set('error_log', '/path/to/log/file');

// Log an error message
error_log('An error occurred in the PHP script');
?>
By following the above best practices and implementing custom logging frameworks you can improve the quality and reliability of your application's logging capabilities. Additionally, by properly configuring log retention settings, you can ensure that your logs are stored appropriately and in compliance with any regulatory or business requirements. Ultimately, these efforts can help you gain better insights into your application's performance and behavior, troubleshoot issues more effectively, and make informed decisions to improve the overall quality of your application.
Conclusion
In conclusion, enabling Diagnostic Logging in Azure App Service is a critical step to troubleshoot your web application. These features provide easy access to your application logs, which can be crucial in diagnosing and fixing issues. If you're interested in learning more about capturing application logs in Azure App Service, be sure to check out the following training module: Capture Web Application Logs with App Service Diagnostics Logging - Training | Microsoft Learn
For more advanced monitoring and diagnostics capabilities, we highly recommend checking out Application Insights. In a later article, we will highlight how to use Application Insights to gain even deeper insights into your web application's performance, availability, and usage. By combining the power of App Service with Application Insights, you can gain comprehensive insights into your web application and ensure that it is running at its best.
