This post has been republished via RSS; it originally appeared at: Microsoft Tech Community - Latest Blogs - .
Troubleshoot Spring Apps OutOfMemory(OOM) issue
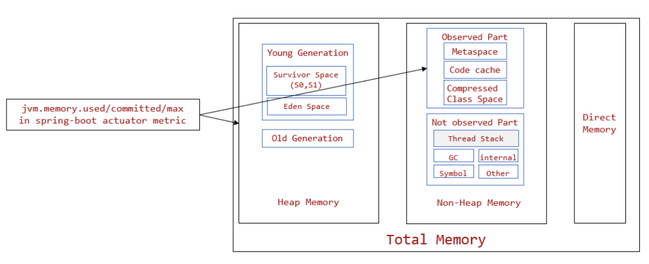
Java Memory Management
- Heap memory
- Young Generation: where all new objects are allocated and aged
- Eden Space: where new objects are allocated
- Survivor Space: where objects moved from Eden after surviving one garbage collection cycle are. Survivor Space is divided to two parts, s1 and s2.
- Old Generation: also called Tenured Space, where objects having remained in the survivor spaces for a long time are.
- Non-heap memory: By default the maximun it size is the 1/4 of the memory requested
- Metaspace : which stores the class definitions loaded by class loaders
- Compressed Class Space: which is for compressed class pointers
- Code Cache: which stores native code compiled by JIT
- Thread stack: Thread Stack memory is used for execution of a thread. It contains method specific values and references to other objects in Heap.
- Direct Memory: native memory used by java.nio.DirectByteBuffer. It is used in third party library like nio, gzip.
Container OOM and JVM OOM
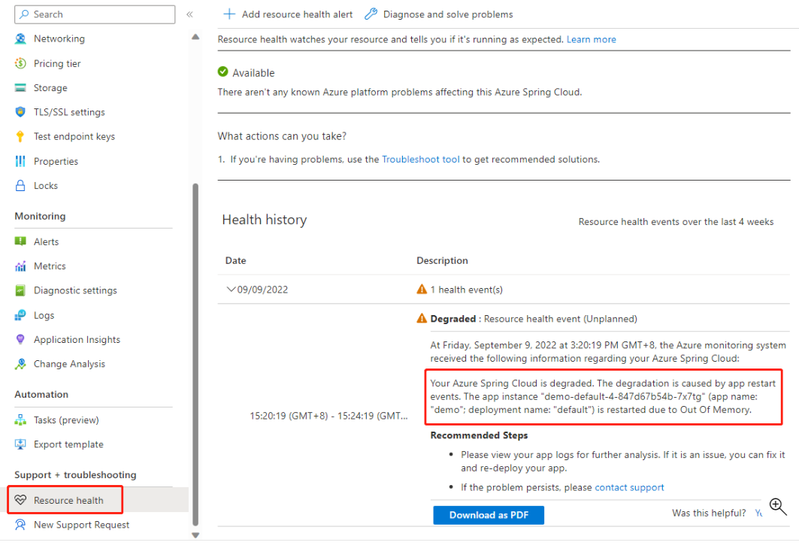
- Container OOM, also called system OOM, occurs when the available app memory has run out. Container OOM issue causes app restart events, which are reported in the Resource Health section of the Azure portal. Normally, container OOM is caused by incorrect memory size configurations.
- JVM OOM occurs when the amount of used memory has reached the maximum size set in JVM options. JVM OOM won't cause an app to restart. Normally, JVM OOM is a result of bad code, which you can find by looking for java.lang.OutOfMemoryError exceptions in the application log. JVM OOM has a negative effect on application and Java Profiling tools, such as Java Flight Recorder.
1. Check JVM OOM event
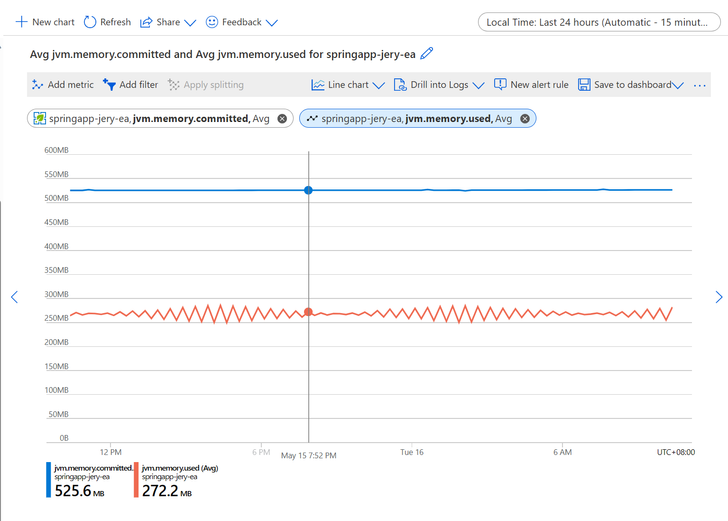
- Go to portal -> Spring Apps -> Metrics -> PERFORMANCE(JAVA) -> jvm.memory.committed / jvm.memory.used, you will be able to see the JVM memory status

- Make sure you have included "spring-boot-starter-actuator" in your project
  <dependencies>
    <dependency>
          <groupId>org.springframework.boot</groupId>
          <artifactId>spring-boot-starter-actuator</artifactId>
      </dependency>
  </dependencies>
Mitigation
- For JVM OOM issue, consider to assign more instance memory and increase JVM Heap memory accordingly.
- Capture Heap dump or Thread dump to analyze the OOM issue
2. Check System OOM
- Portal Resource Health

Mitigation
- For system OOM issue, possible reason is that total memory ( heap + noheap + directmemory) exceed the container memory, we need to limit the direct memory and decrease the heap memory
- The instance total memory actually contains "User App Container" and "System Sidecar Container", you can completely ignore the sidecar container part since this sidecar memory isn't visible and won't consume app container memory usage (also no additional cost). For example, for a 2GB instance:
- Memory that can be used for your app container will be 2GB, it contains:
- JVM heap
- JVM observed part of non-heap memory
- JVM not observed part of non-heap memory (thread stack, etc.)
- Direct Memory
- You can set the jvm options to '-Xms1024M -Xmx1280M -XX:MetaspaceSize=256M -XX:MaxMetaspaceSize=256M -XX:MaxDirectMemorySize=300M '
- Memory that can be used for your app container will be 2GB, it contains:

