This post has been republished via RSS; it originally appeared at: Microsoft Tech Community - Latest Blogs - .
How do you measure the performance of your applications and services over time? If you run load tests regularly, you probably compare the current trends with the baseline. In this blog post, we will explore how Azure Load Testing helps you track trends in client-side metrics across test runs.
If you haven’t tried using the service yet, create an Azure Load Testing resource and get started with your first test run in a few minutes.
Here are some situations where you might want to see how the metrics change over time:
- You run load tests on your pre-production environment every month before releasing new updates. You want to quickly see if your application performance is performing better or worse than before.
- You regularly run load tests as part of your CI/CD pipelines, and you want to have a quick view of metrics across these test runs.
- You are optimizing your application performance. You want to know if these optimizations have made a difference compared to the baseline.
Let’s see how Azure Load Testing can simplify such analyses for you. Read on to find out how Azure Load Testing can show you the trends in metrics from recent test runs and help you evaluate your application performance.
Test scenario
For this demo scenario, let’s assume that our team of engineers develop and maintain a web application. There are frequent user facing feature updates and backend architecture updates happening to this web application. We run performance tests in our pre-production environment to ensure the performance and reliability of our web application, before each release, using a simple load testing scenario that simulates 200 concurrent users browsing the homepage of our web application for 5 minutes.
Azure Load Testing helps us analyze each test run and ensure performance metrics meet our expectations before production deployment We want to see trends in performance over time, Let’s see how to leverage Azure Load Testing for analyzing trends in metrics and comparing recent performance to a baseline.
Analyze trends in metrics
Look across trends in metrics across the test runs for a test without any additional set up. This is the default view for all the successful test runs in ‘Done’ state.
The “Trends” view is available as a separate tab in the Test details pane where the list of test runs is shown. Detailed steps to get to this view are available here.
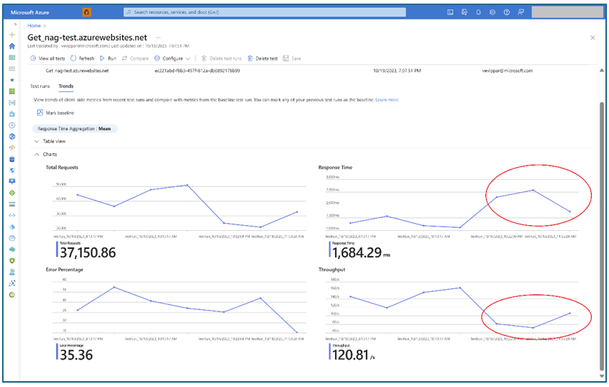
The Trends view shows a graphical view of metrics from the ten most recent runs that are in ‘Done’ state. Charts showing the total requests, response time, error percentage and throughput provide an insight into the trend in performance at a quick glance. By default, the mean response time is shown, but you have the option to select other aggregations like median, 90th percentile, etc. A tabular view of the metrics is also available, and you can get this view by selecting the ‘Table view’ option. 'Table view’ helps you look at the test run description or the exact values of the metrics. If you are interested in analyzing a specific test run that is different from the rest, you can click on the test run name to view the results dashboard of that test run.
For our sample scenario, after 7 releases and a test run for each release, the Trends view will be shown as below.
In our example scenario, by looking at the graphs, we can see that, over the last three test runs, the response time was longer, and the throughput was lower as compared to the earlier runs. Our web application users may be having a relatively bad experience after these recent releases. We can now go and examine the updates that could have caused this performance degradation. We can also look at the actual numbers from the Table view.
Compare recent performance with a baseline
We can also use Azure Load Testing to compare performance metrics from recent test runs with those of a baseline. On the Trends pane, you can use the Mark Baseline option to set any of your previous test runs as a baseline. The detailed steps to mark a test run as a baseline are available here.
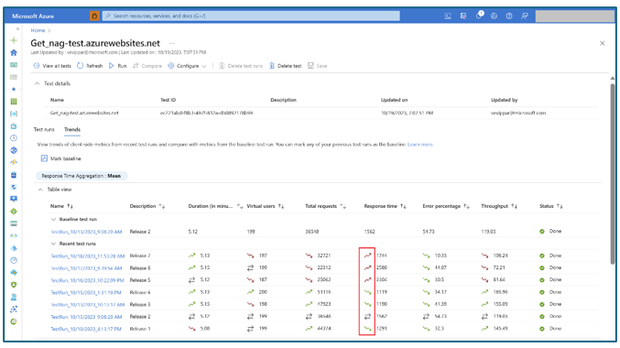
For our scenario, we see that the performance metrics from the test run for Release 2 are satisfactory and we’d like to compare the next test runs with this one. We can go ahead and mark Release 2 as the baseline. Once we do that, we see that the charts now show the baseline value and enable us to understand if the recent performance is better or worse as compared to the baseline.
In addition to this, when we open up the Table view, we can see the baseline test run as a separate row in the table. Metrics from all the other test runs are compared against the ones from the baseline. An arrow mark against each metric indicates whether the metric is trending favorably or unfavorably as compared to the baseline. This helps us get a quick understanding of whether we are doing good or if we need to go fix something.
Summary
To summarize, we used the Trends view in Azure Load Testing to easily see how our web application performed over time, with no additional set up. Additionally, by marking a test run as baseline, we could quickly understand how the recent performance is as compared to the baseline.
If you haven’t explored the Trends view feature yet, try running your performance test using Azure Load Testing and take advantage of the trends view that is readily available for you.
If you have any feedback on the Trends view, or something else in Azure Load Testing let us know through our feedback forum.
Happy load testing!
Additional resources
Azure Load Testing resources: https://aka.ms/MALT-resources.
Previous blogposts on Azure Load Testing here.


