This post has been republished via RSS; it originally appeared at: Azure Data Explorer articles.
Recently Grafana team added a new query builder experience that allows business users to create dashboard panels with no KQL queries.
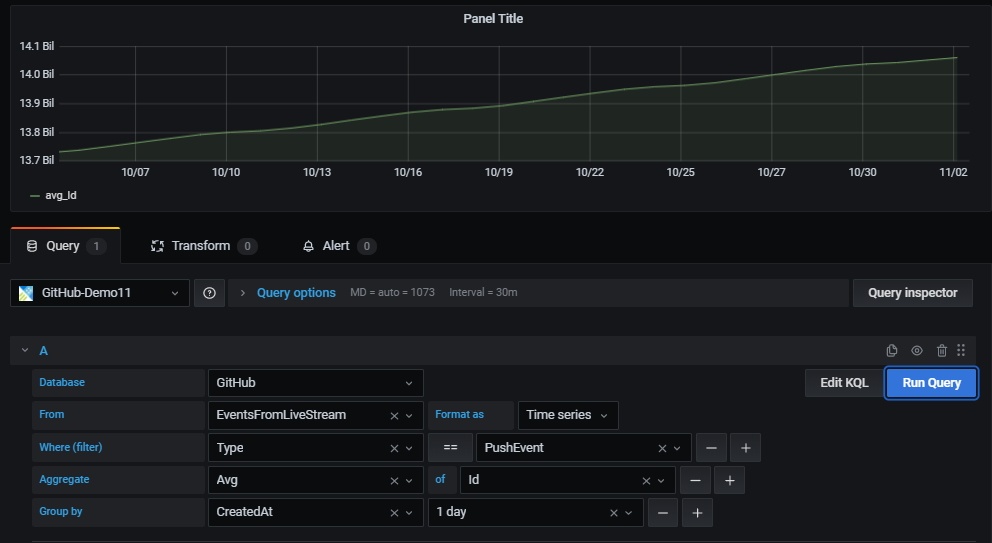
All that is needed to create a new panel, is using simple drop-down controls. The new experience offers an easy and intuitive way to select columns, aggregation functions and filter values to analyze and visualize your data.
Prerequisites
Azure Data Explorer (Grafana) plugin version 3.2.1 or later.
Visualize
Once you have configured a datasource, use a new or an existing dashboard to create a new panel.
In the panel first select the datasource, database and table.
For the selected table, use the UI controls to easily filter, aggregate and group the data and present the result set in the panel.
Filter
Adding filters has never been easier – start with the plus sign (+) to the right of the “Where (filter)” control.
Then select the filter column from the list of table columns, select the comparison operator and type in the value to filter by.
Data aggregation
The aggregate control is used for selecting the aggregation type and also the columns to use for aggregating (optional).
One or more aggregations can be set.
This is equivalent to KQL summarize operator.
Data grouping
The “Group by” control allows users to select one or more columns to arrange the values into groups and label each series differently (with “config overrides”).
This is equivalent to the “by” expression in KQL summarize operator.
Auto-generated KQL query
While creating a panel with the query editor a KQL query is being automatically generated at the bottom of the screen.
The purpose of the query is to show the exact representation of the logic the user constructs with the graphical query editor.
In addition, the user can take the generated query and further enhance it by clicking the “Edit KQL” button to the left of “Run Query” button.
By clicking “Edit KQL” the user will move to the “Raw mode” and he will be able to use the flexibility and power of KQL to finetune his query.
Time shift
This new capability allows easy and intuitive construction of time shifted panels to compare 2 equivalent time periods.
Enabling time shift and defining the duration of the shift is available with the new time shift drop-down below the query.
For example, you can use the same query with 1-week time shift to get a WoW view of your data.
Looking forward for your feedback in GitHub,
Enjoy


