This post has been republished via RSS; it originally appeared at: Core Infrastructure and Security Blog articles.
Introduction to Network Trace Analysis 2: Jumping into TCP Connectivity
Howdy everyone, I hope you're hungry we have a feast of information we will be going through today. Our topic will be the transmission control protocol (TCP) and what you need to know.
Now TCP is a monster so to keep this post from being too long, I'll save TCP performance for another day.
Why is this important?
You may be wondering why I am dedicating a full post to a single protocol, well it's really very simple. All your favorite applications and protocols use TCP!
- HTTP
- SMB
- Windows Communication Foundation
- And many more!
Another reason we are spending so much time on TCP is because it has lots of rules that define how the protocol works. TCP is a reliable protocol, meaning that it does its best to ensure that all data that needs to be transmitted is accounted for. It does this through:
- The tracking of data being transmitted
- The tracking of connection state
By understanding the rules and functionality of TCP you can better troubleshoot it.
TCP essentials
Layout
Let's start by understanding the layout of a TCP packet.
It is important to keep in mind that the field within the TCP packet is relative to the perspective of the client and server.
For example:
Client A sends a TCP packet to Server B.
Transmission Control Protocol, Src Port: 51105, Dst Port: 445, Seq: 0, Len: 0
Server B sends a TCP packet to Client A:
Transmission Control Protocol, Src Port: 445, Dst Port: 51105, Seq: 0, Ack: 1, Len: 0
We can see that from the client perspective the source port is 51105 and the destination port is 445. From the server perspective the source port is 445 and the destination port is 51105.
Breaking down those fields:
- Source Port: An identifier for port a packet is generated from
- Destination Port: An identifier for the location the packet should be received on
- Note: The combination is often referred to as the binding
- Sequence Number: This number is used to keep track of the amount of data that has been sent
- Acknowledgement Number: This is used to track and notify the amount of data that has taken out of the TCP receive buffer
- We will talk more about the TCP receive buffer in the next post
- Flags: The specifications for the packet
- Window Size: The size of the TCP receive window
- We will talk more about the TCP receive window in the next post
- Checksum: This field is used for error-checking
- Urgent pointer: This indicates the last urgent data byte
- Options: These options modify the functionality of the TCP connection
These fields are used to track the state of the TCP connection and the data it is transmitting.
Now let's see these fields in action.
Initiating a TCP Connection (The famous 3-way handshake)
The initialization of a TCP connection will always start with three steps, often referred to as the TCP 3-way handshake.
- The client sends a TCP packet with the SYN flag set to a server port that is listening.
- The server responds with a TCP packet with the SYN flag and the ACK flag set
- The client completes the handshake by sending a TCP packet with the ACK flag set
If these steps are successful, the connection is established.
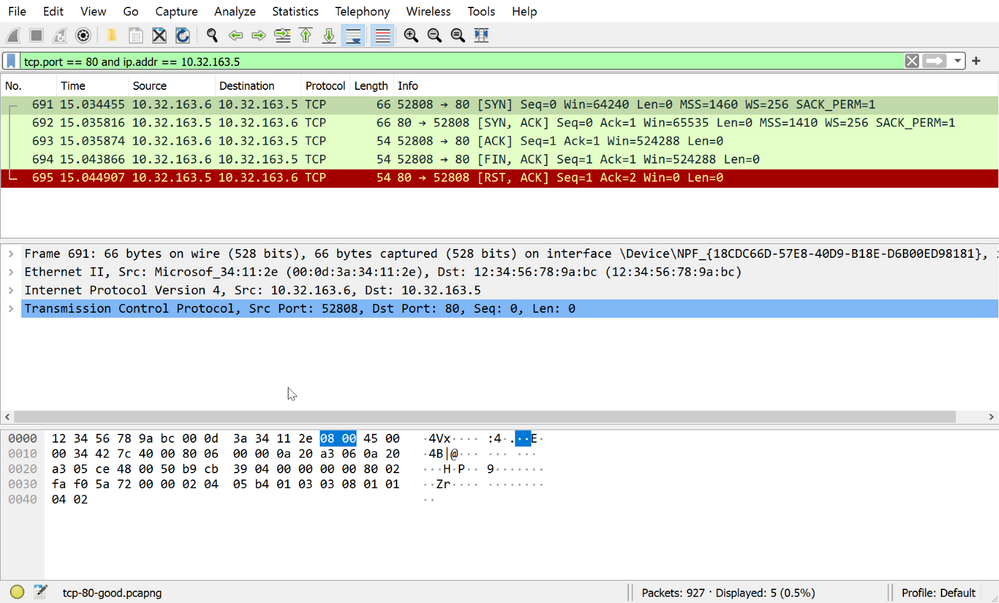
Here is what that would look like in Wireshark.
Now let's breakdown what we can see in the actual capture. The first three frames we can see show us:
- IPv4 address 10.32.163.6 sent a TCP packet from port 52808 to 10.32.163.5 port 80 with the flags SYN, ECN, and CWR
- "I want to communicate with you, let's SYNchronize.
- 10.32.163.5 is listening on port 80 received the TCP SYN from 10.32.163.6 and replied with a TCP SYN ACK
- "Hey, I am ACKnowledging your TCP SYNchronize"
- 10.32.163.6 receives the TCP SYN ACK and replies with a TCP ACK completing the TCP 3-way handshake
- "I am ACKnowledging your ACKnowledgement of my TCP SYN"
After that the connection is established, data can flow and be accounted for.
Are you listening?
We need to take a quick second to talk about what a port “listening” means as this is a common point of confusion.
For a TCP connection to be accepted, the port that is receiving the TCP SYN must be in a listening state. The port in the listening state means that an application has requested that it be allowed to handle ALL inbound traffic on a specific port from 1-65535.
Any inbound traffic to that port over TCP will be handled by the application that requested the port be put into the listening state.
Additionally, this means that only one application can listen on a port at a time.
You can check the state of ports on your machine by using the PowerShell cmdlet Get-NetTCPConnection. And we can look specifically for listening ports by using the -State parameter.
This indicates that any of the ports listed in the local port column are able to accept inbound TCP connections.
The obvious question becomes how does a port get into a listening state?
An application requests the listener. This is very important to remember.
- If the application isn't running, the port will not be listening
- If the application hasn't requested the port listen, the port will not be listening
- If the application crashes, the port will not be listening
Without getting too far into the nitty gritty of Windows network programming, somewhere in the application code it calls listen. But it is the responsibility of the application intending to address traffic on the TCP port to request the listener be created.
Now that we have covered the basics, let's look at some failure examples.
Hello is anybody home?
Let's imagine you are presented with the following scenario. CEO of Contoso Pharmaceuticals calls your desk. They can't get to the end of year report website and need your help now.
Luckily, you've been reading Introduction to Network Trace Analysis and you ask the following questions:
- Q: What is the clients IP address?
- A: 10.32.163.6
- Q: What is the servers IP address?
- A: 10.32.163.5
- Q: What protocol is the traffic using?
- A: HTTP (which uses TCP as the transport)
- Q: Has this ever worked?
- A: It worked until yesterday. Hurry! I have a meeting with the board of directors in an hour!
With this in mind you remember that you can quickly test the TCP transport using PowerShell, and run the following command:
Your tests have failed and there appears to be a communication issue. Time to take a trace! You collect a simultaneous two-sided network trace while running your test, you use the filter, tcp.port == 80 and ip.addr == 10.32.163.5 and you see this on the client:
A bunch of scary black and red text. And on the server:
That's a lot of scary black and red text.
Before we panic and call the networking team, let's think about what the trace tells us.
- The client sent a TCP SYN
- The server received a TCP SYN
The first part of the TCP 3-way handshake is started, but why wasn't a TCP SYN ACK sent by the server? If we think about what we learn earlier about what is needed for the 3-way handshake to complete let's start with step 1.
The client sends a TCP packet with the SYN flag set to a server port that is listening.
The obvious question becomes, is the server port listening?
On the server you run the following:
From the output we can see that we have some ports in a listening state but port 80 isn't one of them. With this information you call up the webmaster and mention that the port isn't listening.
- You: "Hey is the webapp up and running right now?"
- Web Master: "Looks like someone forgot to start the service after maintenance. Let me start it now"
After the webmaster starts the webapp, you run your test again.
Crisis averted!
By understanding the basics of the TCP 3-way handshake we were able to:
- Identify where the issue was occurring
- Why the server wasn't sending the TCP SYN ACK
- Request the right parties resolve the issue
Interference
Let's move onto the next scenario. I have a Windows File server that I can't access. Why?
Starting with the questions:
- Q: What is the client’s IP address?
- A: 192.168.1.100
- Q: What is the server’s IP address?
- A: 192.168.2.10
- Q: What protocol is the traffic using?
- A: SMB (Which uses TCP as the transport over port 445)
- Q: Has this ever worked?
- A: Yep, worked until this morning.
Testing our TCP transport:
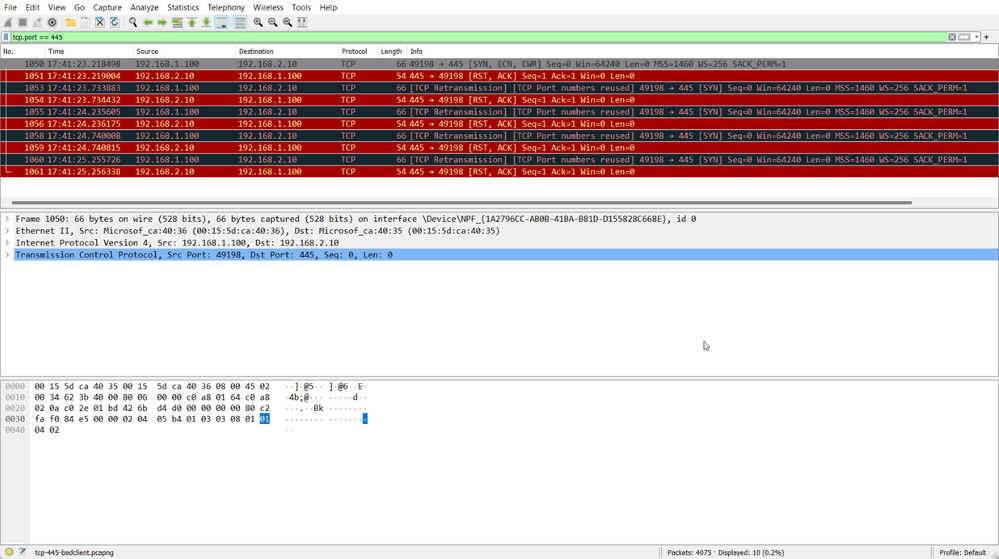
Nothing terribly surprising, the communication failed. We collect a two-sided capture while we reproduce the issue. Here is what we can see on the client:
Weird... We are getting TCP ReSeT to the TCP SYN. What does the server show us?
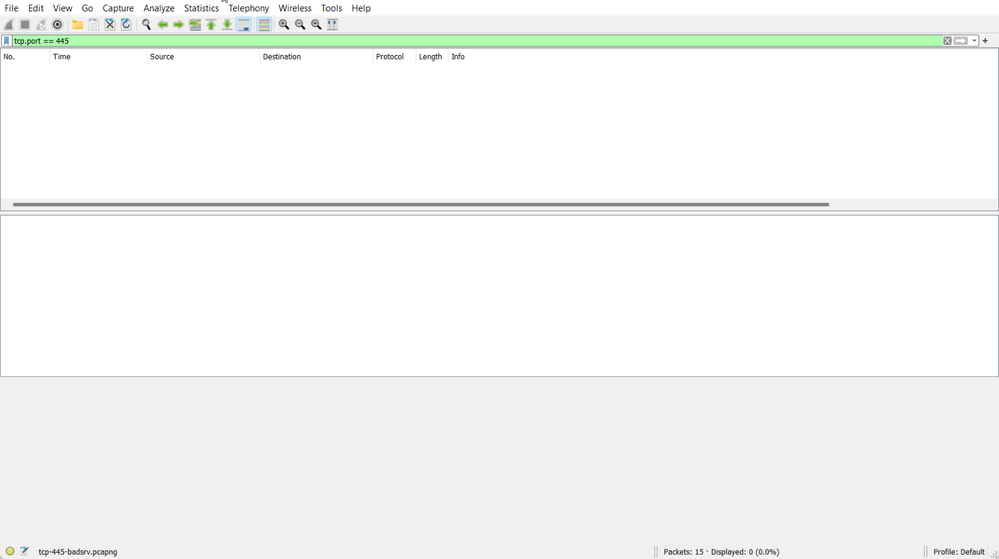
Nothing. And if we remove the filter, we can see other packets so we know our capture worked but we don't see any TCP packets on port 445.
The server has received nothing and sent nothing. What's the deal? RST isn't a part of the TCP 3-way handshake?
A ReSeT is the TCP flag to indicate "I'm done with this conversation. Free up these ports now". This leaves us with a few questions.
- Why is the client receiving a TCP RST?
- Why isn't the client receiving a TCP SYN ACK?
- Why don't we see the server send the TCP RST?
For this, we are going to learn a bit about IPv4. Here is the expanded IPv4 section within Wireshark for the TCP SYN that the client sent:
Frame 1050: 66 bytes on wire (528 bits), 66 bytes captured (528 bits) on interface \Device\NPF_{1A2796CC-AB0B-41BA-B81D-D155828C668E}, id 0
Ethernet II, Src: Microsof_ca:40:36 (00:15:5d:ca:40:36), Dst: Microsof_ca:40:35 (00:15:5d:ca:40:35)
Internet Protocol Version 4, Src: 192.168.1.100, Dst: 192.168.2.10
    0100 .... = Version: 4
    .... 0101 = Header Length: 20 bytes (5)
    Differentiated Services Field: 0x02 (DSCP: CS0, ECN: ECT(0))
    Total Length: 52
    Identification: 0x623b (25147)
    Flags: 0x40, Don't fragment
    ...0 0000 0000 0000 = Fragment Offset: 0
    Time to Live: 128           <--------------------
    Protocol: TCP (6)
    Header Checksum: 0x0000 [validation disabled]
    [Header checksum status: Unverified]
    Source Address: 192.168.1.100
    Destination Address: 192.168.2.10
Transmission Control Protocol, Src Port: 49198, Dst Port: 445, Seq: 0, Len: 0
There are some cool things in here but we are going to focus on the Time to Live (TTL).
The TTL is the maximum number of network segments a given packet can traverse (hops). And Windows uses a default TTL of 128.
Let's use tracert to help explain this concept.
From this output we can see that to get to bing.com we go through 9 hops. Meaning the TCP SYN that arrives at bing.com would have a TTL of 119 (128 - 9).
The decrementing of the TTL value is done by the routers that route the packet between networks.
With that in mind, let's take a look back at our trace.
// Outbound TCP SYN
1050 17:41:23.218498 192.168.1.100 192.168.2.10 TCP 66 49198 → 445 [SYN, ECN, CWR] Seq=0 Win=64240 Len=0 MSS=1460 WS=256 SACK_PERM=1
Frame 1050: 66 bytes on wire (528 bits), 66 bytes captured (528 bits) on interface \Device\NPF_{1A2796CC-AB0B-41BA-B81D-D155828C668E}, id 0
Ethernet II, Src: Microsof_ca:40:36 (00:15:5d:ca:40:36), Dst: Microsof_ca:40:35 (00:15:5d:ca:40:35)
Internet Protocol Version 4, Src: 192.168.1.100, Dst: 192.168.2.10
    0100 .... = Version: 4
    .... 0101 = Header Length: 20 bytes (5)
    Differentiated Services Field: 0x02 (DSCP: CS0, ECN: ECT(0))
    Total Length: 52
    Identification: 0x623b (25147)
    Flags: 0x40, Don't fragment
    ...0 0000 0000 0000 = Fragment Offset: 0
    Time to Live: 128             <--------------------
    Protocol: TCP (6)
    Header Checksum: 0x0000 [validation disabled]
    [Header checksum status: Unverified]
    Source Address: 192.168.1.100
    Destination Address: 192.168.2.10
Transmission Control Protocol, Src Port: 49198, Dst Port: 445, Seq: 0, Len: 0

// Inbound TCP SYN-ACK
1051 17:41:23.219004 192.168.2.10 192.168.1.100 TCP 54 445 → 49198 [RST, ACK] Seq=1 Ack=1 Win=0 Len=0
Frame 1051: 54 bytes on wire (432 bits), 54 bytes captured (432 bits) on interface \Device\NPF_{1A2796CC-AB0B-41BA-B81D-D155828C668E}, id 0
Ethernet II, Src: Microsof_ca:40:35 (00:15:5d:ca:40:35), Dst: Microsof_ca:40:36 (00:15:5d:ca:40:36)
Internet Protocol Version 4, Src: 192.168.2.10, Dst: 192.168.1.100
    0100 .... = Version: 4
    .... 0101 = Header Length: 20 bytes (5)
    Differentiated Services Field: 0x10 (DSCP: Unknown, ECN: Not-ECT)
    Total Length: 40
    Identification: 0x0000 (0)
    Flags: 0x40, Don't fragment
    ...0 0000 0000 0000 = Fragment Offset: 0
    Time to Live: 64             <--------------------
    Protocol: TCP (6)
    Header Checksum: 0xb601 [validation disabled]
    [Header checksum status: Unverified]
    Source Address: 192.168.2.10
    Destination Address: 192.168.1.100
Transmission Control Protocol, Src Port: 445, Dst Port: 49198, Seq: 1, Ack: 1, Len: 0
Wow that is a huge difference in TTL. This would mean that we traversed 64 different networks to get a response, right? Well not exactly...
Let's do a tracert between the two machines to understand if we are really going through 64 hops.
Trace complete.
That is odd. We only have 1 hop between us and the destination. So why is the TTL 64? And where is the TCP RST coming from?
Well, earlier we talked about the default TTL being 128... for Windows.
Other operating systems have their own default TTL, the breakdown is typically as follows.
|
OS |
Default TTL |
|
*nix |
64 |
|
Windows |
128 |
|
Solaris |
255 |
So given this information we can make a few statements that can help us figure out what is going on.
- The client sends a TCP SYN and receives a TCP RST
- The server neither receives a TCP SYN nor sends a TCP RST
- The default TTL of Windows is 128
- The TTL of TCP RST is 64
- The default TTL of *nix based operating systems is 64
Our two options are:
- "We have an asymmetric route that adds 64 additional hops on the return packet and Wireshark failed to capture the inbound TCP SYN and outbound TCP RST from the server"
Or
2. A *nix based device between the two machines is rejecting the traffic preventing the server from receiving it
I think we know which is more likely...
Conclusion
This information may seem obvious, but it is often the underlying cause of a whole slew of issues. Keeping in mind a few of our key takeaways:
- The TCP 3-way handshake must succeed before any data can flow
- TCP has both protocol states and port states
The good news is we will have less setup in our next post as we will be continuing into TCP performance! I'll catch you later!
Previous posts in series:
- Introduction to Network Trace Analysis Part 1: Asking Questions and Collecting Data
- Introduction to Network Trace Analysis Part 0: Laying the Groundwork


