This post has been republished via RSS; it originally appeared at: Microsoft Tech Community - Latest Blogs - .
Holiday shopping is coming up. Black Friday, Small Business Saturday and Cyber Monday will test your app’s limits, and so it’s time for the technical teams to ensure that the digital platforms deliver when it is needed the most. Be it shopping applications on the web and mobile or payment gateways or banking systems supporting payments or inventory systems or billing systems – anything and everything associated with the shopping season should be prepared to face the load. You don't want to lose that 1 in a 40 visitor that actually makes a purchase.
App resilience is imperative to keep up with the higher customer demand during the holiday season. A key approach to ensuring app resilience is to perform load testing. Ideally, you want to test every application component, however the bare minimum is to ensure that all critical user flows are tested. For example, you want to ensure that customers can checkout items and complete the purchase.
So, load testing is an essential activity, but what does it actually take to put this in place?
- How do I get started? Do I handcraft a load testing script?
- How can I simulate user load patterns?
- What are the infra needs to simulate such a large load?
- How do I analyze the test results and put them to action?
- And more importantly, how much time and effort does my team have to spend on this?
What if I say that ‘You can do more with less’? Let’s see how Microsoft Azure Load Testing and Apache JMeter can help you achieve this.
Sample shopping application
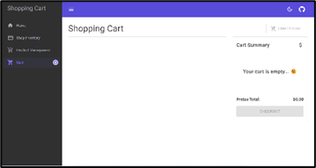
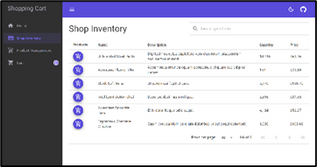
For the purpose of this blog post, we'll use the Contoso Shopping Cart sample shopping website. It has a landing page, a shop inventory page that has a list of products and a cart page that shows the products selected for checkout. This application is hosted using Azure App Service and uses a Storage Account and Application Insights.

Load pattern set up
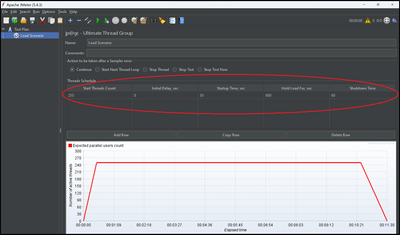
Let's say Contoso has announced that the offers will go live at midnight on Thursday (12:00 AM, November 25, 2022) for the Black Friday sale. Contoso has also run great marketing campaigns and customers are eagerly waiting. Now, it is up to the website to not let down all of this great effort and expectations. In this scenario, the load will start picking within a few seconds and will soon reach to peak load. The peak load will sustain for few minutes to hours depending on the traffic and stock availability. All through this period, we want to make sure that the critical user flow is seamless. Simultaneously, there will be a bunch of users showing up on the home page, some browsing through the list of products and some checking out their selection.
This load scenario can be easily set up in JMeter using the Ultimate Thread Group plug-in as shown below. The load increases to 250 concurrent users in 30 seconds, then the peak load continues for 10 minutes (600 seconds) and then it tapers off in 60 seconds.
Is this the only load pattern that we should test against to gain confidence in handling the shopping season load? Definitely not, there are many other patterns, and the ultimate thread group can be used to set up all these. We will have that discussion on what load patterns should be looked at and how to set those up in another blogpost soon.
Recording the user flow in JMeter
The recording feature in JMeter makes it easy to capture the user journey in the form of a test script (JMX file) saving us from the tedious job of setting up the test manually.
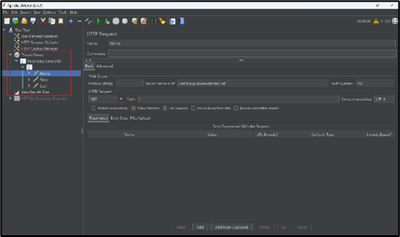
For the purpose of this demo, let’s say that an authenticated user lands on the home page, navigates to the shop inventory page, selects some products and proceeds to the cart page. We can record this user flow using the JMeter recording controller and easily get out test script ready.
If you haven’t tried JMeter recording before, follow the instructions here to configure your browser to use the JMeter proxy, record your navigation and then correlate your script.
Here, we have used the JMeter recording template to set up the script
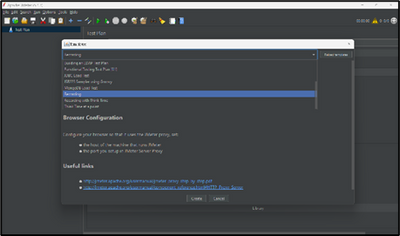
When a web page loads, besides the requests associated with loading the website content, multiple other requests such as the ones related to social media, web analytics, social media icons etc. are also involved. It is not a big problem if such requests fail in high load scenarios. It is better to avoid these requests in the test plan to declutter the test results.
JMeter provides the option to select what requests to ‘Include’ and what to ‘Exclude’ based on URL patterns. While the JMeter recording template filters out few such requests by default, we can add custom exclude and include patterns to narrow down on the requests that mean the most for the scenario under observation.
We have done the same here
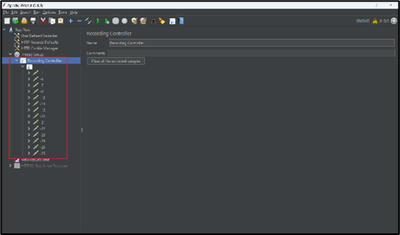
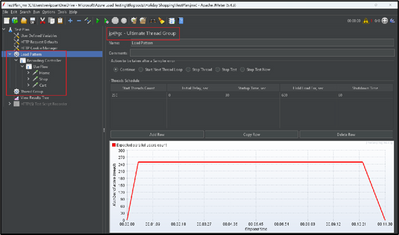
Since we used ‘Ultimate Thread Group’ to set up our load pattern, we can add that thread group and move the recording controller under it.
The set up in JMeter is all done. Go ahead and save the script (.jmx file). We will use it in the next step.
Performance testing using Azure Load Testing
Now that our critical user flow is properly captured, let’s use this script in Azure Load Testing and observe the results.
Why Azure Load Testing? Because you don't want to provision hardware and do a JMeter set-up. Time is money! Also, in the next section, you'll see that you get a wealth of insights!
Create an Azure Load Testing resource and create a test using the JMeter script that we created above.
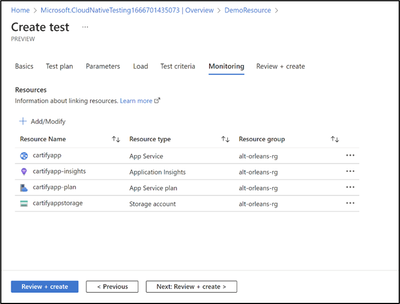
We will also monitor the app components to see how they perform under load.
It just takes 2 minutes to set this test up and run it. You have already addressed all of your infra needs! You get charged only for the duration of the test run, don’t worry about de-provisioning.
Analyzing results and gaining insights
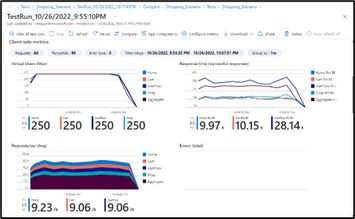
We are eager to know if our application was able to take the load and the critical user flow was seamless. Looking at the test results, we can see that the load pattern is exactly as configured and the application was able to take a load of 250 concurrent virtual users without showing any deterioration in performance – fairly constant response time, no errors. You can customize the metrics dashboard by using the filters to pick specific requests, error types, choose a time frame etc.
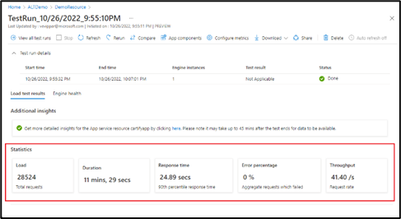
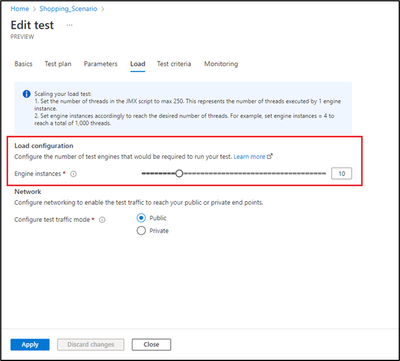
We will now increase the load to discover the breakpoint for this application and find out which app component is becoming the bottleneck. This can be done by simply increasing the number of engine instances in the ‘Load’ tab of the test creation wizard.
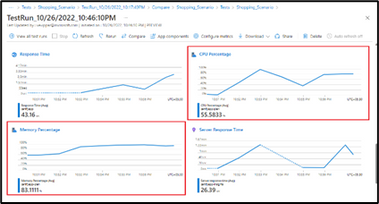
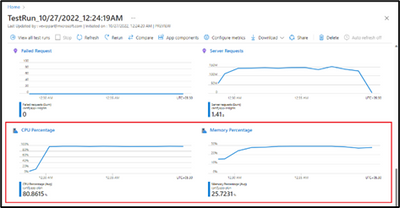
When the load increased to 1000 concurrent virtual users (4 test engines), the application’s response time has increased but there were no errors. This is not a concern as users expect longer response times in shopping season. However, when the load increased to 2500 concurrent virtual users (10 engines), the application started to give error responses and the test got aborted due to high error rate. Looking at the server-side metrics, we can see that the App service plan has almost 100% memory utilization and the CPU utilization was also going high.

Now that we know that our App Service, with the current plan, is not able to scale, we will scale up the App Service plan from B1 tier to P2V3 tier to see if that improves the metrics.
When we run the test again with 2500 concurrent virtual users, we can see that there are no errors, and the response time is back to normal. We also see that the memory utilization of the App Service plan is well within limits. However, the high CPU utilization is still a concern.
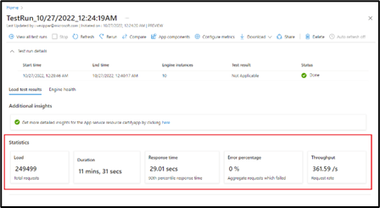
With this exercise, we came to know that our application, in the current set up (B1 tier for App Service plan) can scale up to 1000 concurrent users and the critical user flow will be seamless. It will start throwing errors for higher loads. By looking at the data from the previous shopping seasons, I will know if this is acceptable or not. In case our earlier experience says that we have never seen 1000 concurrent users but suddenly, this season we happen to see higher loads, we know that scaling up the app service plan will quickly resolve the performance issues. So, we are all geared up for the shopping season.
What else are you waiting for? Go ahead and get started with Azure Load Testing. Try it out and let the community know about your preparation for the shopping season.
If you have any feedback on Azure Load Testing, let us know through our feedback forum.
Happy Load Testing…!
Resources
To learn more about Azure Load Testing, here are a few links to get you started:
- Azure Load Testing - Tools and Services | Microsoft Azure
- Azure Load Testing documentation | Microsoft Learn
- Introducing Azure Load Testing | Azure Friday
- DevOps Lab | Introducing Azure Load Testing | Ep 1
- DevOps Lab | Introducing Azure Load Testing | Ep 2
- Quickstart: Create and run a load test with Azure Load Testing | Microsoft Learn
- Tutorial: Run a load test to identify performance bottlenecks - Azure Load Testing | Microsoft Learn
- Tutorial: Automate regression tests with CI/CD - Azure Load Testing | Microsoft Learn

