This post has been republished via RSS; it originally appeared at: Microsoft Tech Community - Latest Blogs - .
The Azure Data Studio team is pleased to announce the General Availability of both Table Designer and Query Plan Viewer in release 1.40. Both features were initially available in preview earlier this year, and the team has endeavored to collect and implement user feedback to shape the final vision for each feature. We will continue to leverage user suggestions to drive improvements not just for these two newly available features, but for new functionality within Azure Data Studio.
Table Designer General Availability
The goal of Table Designer is to provide a visual editor experience for creating and managing table structures in SQL Server databases using the graphical user interface (GUI) without need for manual scripting. If you are new to Table Designer, and all its great features, please watch this Data Exposed video.
While Table Designer was in public preview, we had multiple interactions with users, gathering feedback to make iterative improvements on this feature. Let us take a quick walk down memory lane to highlight some of the major milestones we have achieved up to this point.
- In the 1.36 release, we introduced additional table types: Memory-Optimized, System-Versioned, Node graph, and Edge graph tables.
- In the 1.37 release, we brought improvements focused on column management flexibility by adding support for computed columns and column reordering. We also introduced support for Table Designer with the SQL Database Projects extension to improve the capabilities of disconnected database development.
- In the 1.38 release, we addressed several accessibility and performance issues to allow for a smoother user experience.
- In the 1.39 release, we added additional support for the creation of filtered indexes and included columns for nonclustered indexes. We also provided support for hash indexes in Memory-Optimized tables, Columnstore indexes, as well as support for Ledger objects.
Since August, we have hosted several user group sessions to foster engagement and feedback used to improve on the Table Designer. For example, a suggestion was provided to have period columns added by default when the System-Versioning table type was selected to save the user time from adding these dependencies. We also made improvements that were inspired from a user group session to prevent inexperienced users from unexpected availability issues when performing operations that involve more than just a metadata change; adding columns in between existing columns, for example. Depending on the size of the table, and the hardware, this can be a lengthy operation which potentially consumes significant disk space for the transaction log and may lead to unexpected downtime. To help proactively mitigate such issues, a check box was added for the user to confirm these changes before updating to the database. We continued to fix accessibility and performance bugs which contributed to our goal in making this feature generally available and are extremely proud of our engineering team for accomplishing this feat. To learn more about the Table Designer and for hands-on practice with this feature, please refer to this tutorial on creating and managing tables using the Table Designer on Azure Data Studio.
Query Plan Viewer General Availability
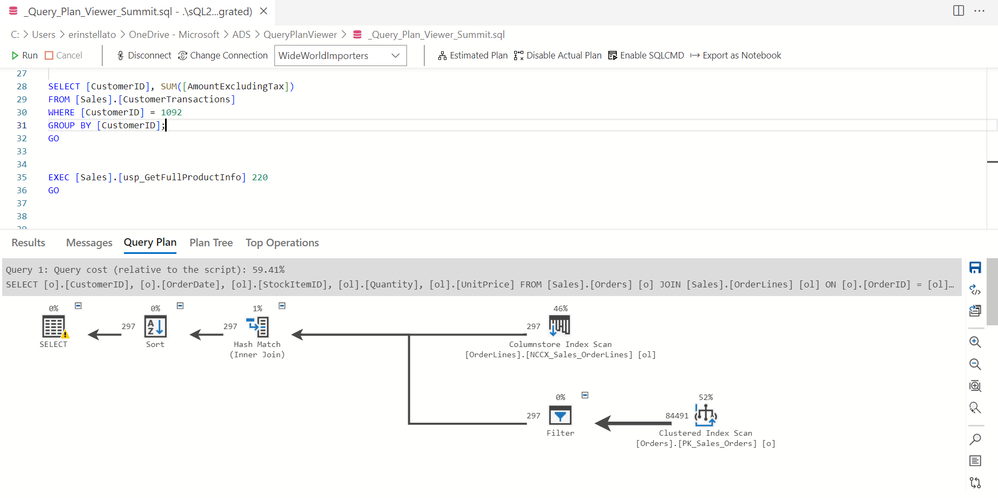
Azure Data Studio provides users with the ability to complete operational tasks such as deploying a database, creating tables, and writing queries. A logical next step for many users is troubleshooting or improving query performance, a task that is now easier with the general availability of Query Plan Viewer. From the query editor, you now have the ability to display the estimated or actual plan for a query or set of queries. This graphical plan provides a visual map to understand the steps the SQL Server engine takes when it retrieves or modifies data. Saved plans can also be viewed in Azure Data Studio, and for enhanced troubleshooting, two plans can be compared to understand differences and more easily identify problems.
As with Table Designer, the team solicited user feedback from community members and MVPs to identify gaps, areas for improvements, and requests for functionality. Without this input, the feature would not exist in its current form. A few notable highlights:
- Top Operations – An additional pane in the output, within this view you can sort on any column, filter to find operations of interest, and click on an operator to then have it highlighted in the plan.
- Plan Comparison – Available via the right-click menu, or from the toolbar on the right, you can compare two plans in either a vertical or horizonal manner. If differences are not readily apparent visually, you can use the Properties window to examine attribute values in detail.
- Plan Comparison Properties – When comparing the properties between plans, the default layout brings attributes with different values to the top of the display (though you can also sort alphabetically), with equivalent properties at the bottom. Further enhancements include filtering for specific values and the ability to collapse and expand attribute groupings.
Users that have worked with query plans previously will likely appreciate that tooltips only display when you click on an operator. And if you don’t want to see tooltips at all, you can disable them for the plan. Additionally, you can quickly find the most expensive operation within the plan, and you can customize whether it’s based on cost, elapsed time, or elapsed CPU time, for example.
If you’re interested in learning more, please review the Query Plan Viewer documentation for Azure Data Studio, or check out the recent Data Exposed video on the topic. Whether you start analyzing plans immediately, or down the road, we hope this new functionality makes it easier for you to identify the problem, so you have more time to fix it.


