This post has been republished via RSS; it originally appeared at: New blog articles in Microsoft Community Hub.
SQL Insights for Azure SQL Db allow you to have a quick look into the resource usage of your Azure SQL Resource in a graphical way, but when we need to troubleshoot it, it sometimes presents a challenge. This article is based on troubleshooting done to solve a case related to the metrics that were not visible on the SQL Insights (Preview) tab.
This feature SQL Insights (Preview) uses a Linux virtual machine to collect metrics for Azure SQL, and it can use credentials stored in Azure Key Vault to authenticate on the SQL Databases.
First step to troubleshoot, we need to check status for the Virtual machine if it is Collecting with errors or Not Collecting. You can check this on the Manage Profile option.
For this specific case, the profile was in status Not Collecting, as can be seen on image above and we could see the below error message also.
Going to Our Azure Virtual Machine, on Tab Extension + application, we can check that the Workload.WLILinuxExtension is not possible to automatically update. Having a deeper look on the troubleshooting documentation in à Troubleshoot SQL Insights (preview) - Azure SQL Database | Microsoft Learn, you will see that on the known Issues, there is one record as below :
A message "WLI extension on this machine is below the recommended version [...]" may incorrectly appear even when the WLI extension is up to date.
Based on the above, the issue might not be related to this extension, so we have to continue our investigation.
Next step let’s check the Virtual machine created. The requirements for the VM are below :
- Operating system: Ubuntu 18.04 using Azure Marketplace image.
- Recommended minimum Azure virtual machine sizes: Standard_B2s (2 CPUs, 4-GiB memory)
As we are using the key vault to store the password used to connect to the database and collect the metrics, we need to check also if the below points are valid.
- Network connectivity exists between the monitoring Vm and the Azure key Vault.
- Permission where provided to the Managed Service Identity of the monitoring virtual machine on the Azure Key Vault.
- We have firewall rules in place on the Azure SQL DB Server to allow the monitoring virtual machine to connect.
To make sure the Virtual Machine is connecting, inn our case to the Azure SQL DB let’s check on the auditing if we see any connectivity from the monitoring Virtual Machine.
Simply going to the Azure Portal and selecting our database we can navigate to the Auditing tab to check for the Authentication events from the Monitoring VM. We find the below records that proofs the Machine can connect.
- Event time (UTC)
1/9/2023 4:27:16 PM
- Event type
DATABASE AUTHENTICATION SUCCEEDED
- Server name
SQL Server Name
- Database name
SQL Database Name
- Application name
go-mssqldb
- Principal name
Username
- Client IP
20.54.*.* ß This is the Azure Monitoring Virtual Machine Public IP.
- Status
Succeeded
We can also see on the Audit that some Batches are successfully executed from the same IP, so from this part we are ok also.
Until now, everything looks good on our configuration, so next, steps, we need to connect to the Linux VM.
As an example, lets use Putty, you can download it here à Download PuTTY - a free SSH and telnet client for Windows .
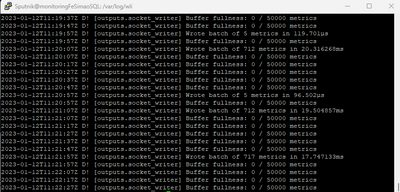
For this troubleshooting we will connect to though SSH to port 22 of our Linux machine. We want to check the bellow logs that are mentioned on the troubleshooting documentation.
wli service logs – can be found on path /var/log/wli/wli.log
Telegraf service logs - /var/log/telegraf/telegraf.log
If any of these logs can guide us a little bit closer to the error, we would expect to have a clear error message here, specially the telegraf log, like cannot login on SQL database or cannot resolve server name. If everything is working fine on these logs the content should be similar to the below images.
We want to troubleshoot another Known Issue that is documented. We want to check if the hostname of the OS matches the Virtual machine Name in Azure portal. This is documented on the Troubleshooter for SQL Insights as below.
Data collection and visualization may not work if the OS computer name of the monitoring VM is different from the monitoring VM name.
We can check this using the below command.
On this specific case we worked, this was the problem that was causing the issue. All Metrics were being collected successfully, but the different hostname caused the failure to show the metrics in the portal. This can be fixed by using the command below and restarting the Virtual Machine. Please note that for Machines created using Azure portal, the Hostname will match Virtual machine name. For other ways to create the Virtual machine, this can be different.
Hope you all enjoy using SQL Insights :smiling_face_with_smiling_eyes:


