This post has been republished via RSS; it originally appeared at: Microsoft Tech Community - Latest Blogs - .
Today we announced the limited public preview of our new Azure HPC + AI storage service - Azure Managed Lustre. I’m beyond humbled and honored to be writing our first HPC tech blog on this new first-party storage solution.
In this first blog, it makes most sense to address, perhaps, the most commonly-asked question that our partners have had through our private preview program -
How do I test how fast an Azure Managed Lustre cluster can go?
We run running several flavors of tests every day on clusters ranging in size from 8TiB to 750TiB in our scale and performance testing. I’ll provide a glimpse into some of those at the end of this article but here’s what I would do if I wanted to show a cluster maxing out its throughput capacity.
File system and client configuration
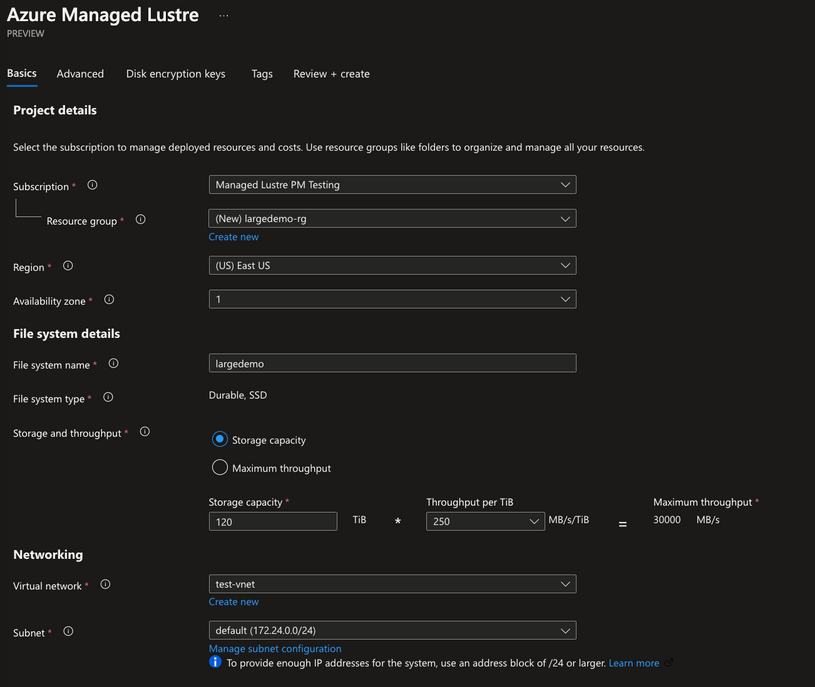
For this test, deploy an Azure Managed Lustre file system that is 120TiB in size. Choosing the 250MB/s/TiB performance tier, you should expect a maximum of 30GB/s of total throughput.
For the client side of the test, you’re welcome to use any of our HPC VM sizes but I’m using ten (10), general purpose Standard_D48s_v3 VMs just for simplicity reasons. To some extent, it’s cool to be able to generate this amount of throughput with a general purpose VM.
When choosing the type, know that it’s important to understand the limiting parameters for each VM. In my case here, I’ll be limited by the expected network bandwidth for each Standard_D48s_v3 (24000Mbps / 8 = 3000MB/s per VM).
|
Size |
vCPU |
Memory: GiB |
Temp storage (SSD) GiB |
Max data disks |
Max cached and temp storage throughput: IOPS/MBps (cache size in GiB) |
Max burst cached and temp storage throughput: IOPS/MBps2 |
Max uncached disk throughput: IOPS/MBps |
Max burst uncached disk throughput: IOPS/MBps1 |
Max NICs/ Expected network bandwidth (Mbps) |
|
Standard_D48s_v3 |
48 |
192 |
384 |
32 |
96000/768 (1200) |
96000/2000 |
76800/1152 |
80000/2000 |
8/24000 |
With ten VMs, then, I’ll have ~30 GB/s of aggregate throughput at my disposal. Note that this “Expected network bandwidth” value is defined as the “upper limit” that you should expect from the VM at any one time.
Client Prerequisites
We like to use IOR and mdtest for most of our tests in our lab. The installation of MPI and IOR probably deserves a blog of its own but spending time on that here is outside of the scope of today. The Lustre Wiki page does have some instructions to help you get started.
The clients will also need to have the Lustre client software installed. We pre-build, test, and publish client packages on the Linux Software Repository for Microsoft Products for most of the major distros today. Installing the right package is as simple as running a script.
Running the test
If you’ve made it this far, the hard work is done. Now for the fun part, let's run the test. The following command is an attempt at simulating some our customers’ seismic processing workloads. It’s something we run internally every day to make sure that what we’re building can handle the work and, as you can see, also does a nice job of showing how to max out the throughput capacity of a given cluster.
Pick a client and run this:
mpirun --hostfile hosts.txt --map-by node -np 480 /home/azureuser/ior -z -w -r -i 2 -m -d 1 -e -F -o /lustremnt/ior/test.file3 -t 32m -b 8g -O summaryFormat=JSON -O summaryFile=/lustremnt/ioroutput/out.nn_tput
IOR will provide a detailed summary of the test results once complete. If you used the command above, this summary will land in the /lustremnt/ioroutput/out.nn_tput file.
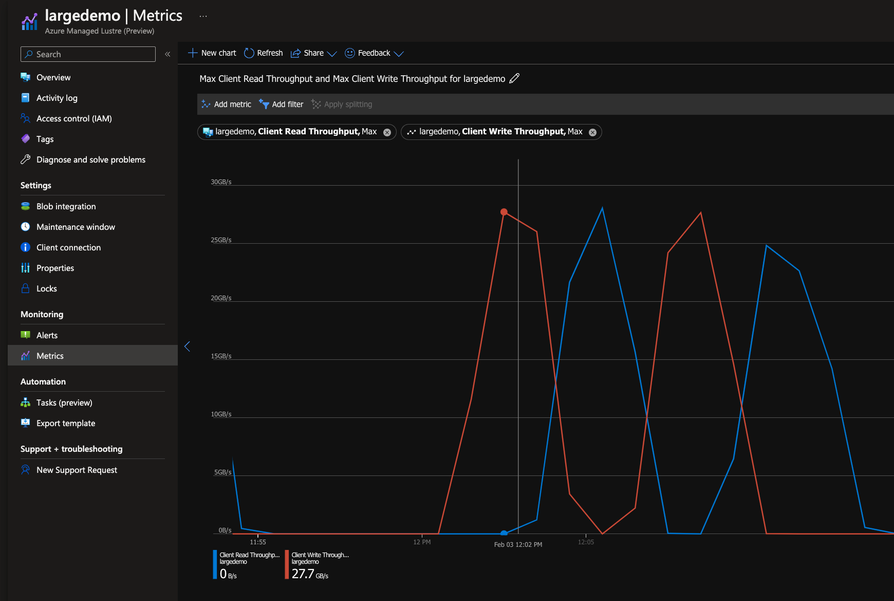
The IOR summary is a client-side view of the test. To see the server-side of the test, you can look to the metrics page in the Azure portal. There are several ways to see the metrics. The most straight-forward way to look at metrics for your Azure Managed Lustre file system is to start from the Azure Managed Lustre overview page (left-side banner, monitoring -> metrics). The picture below shows the aggregate write and read throughput during this test reaching about 30GB/s (the theoretical maximum throughput for this particular cluster and client configuration).
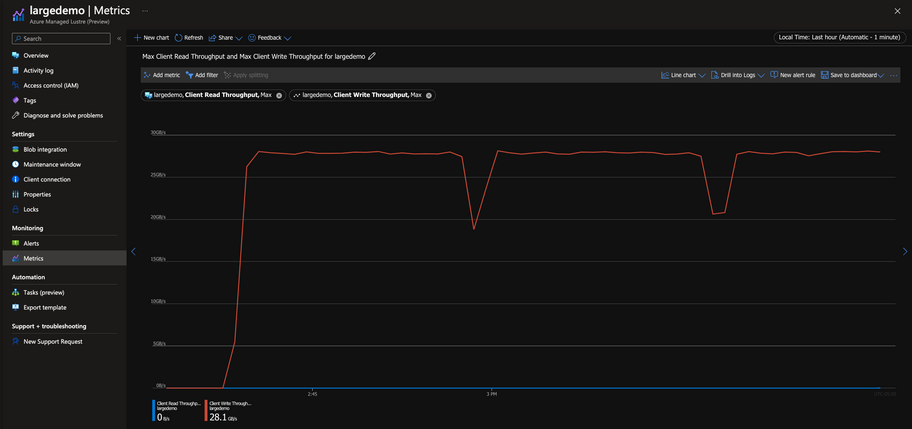
The test above attempted to demonstrate a quick burst of throughput from several clients and processes at once (10 clients, 480 total processes). If you’re more of a “steady-stream benchmarker”, something like this can be run.
mpirun --hostfile hosts.txt --map-by node -np 480 /home/azureuser/ior --posix.odirect -g -v -w -i 3 -D 0 -k -F -o /lustremnt/ior/test.file4 -t 4m -b 4m -s 16384 -O summaryFormat=JSON -O summaryFile=/lustremnt/ioroutput/out.nn_tput2
Here's what the portal metrics graph looks like for this test.
If you're having too much fun and want to keep going, I'll list some of the other tests that we run most often. These weren't designed to max out a cluster's throughput but perhaps these will give you the tools to model a test that looks more like your specific application.
Random buffered block size variation blocksize -b 4g vs 128m and random access -z=1
mpirun --hostfile /home/azureuser/hosts.txt --map-by node -np 1600 /home/azureuser/ior  -b=\"128m\" -F=1 -e=1 -d=5 -m=1 -z=1 -i=3 -t=\"4k\" -o /lustremnt/ior/iops_n_to_n_rnd_buffered.testFile
mpirun --hostfile /home/azureuser/hosts.txt --map-by node -np 1600 /home/azureuser/ior  -b=\"4g\" -F=1 -e=1 -d=5 -m=1 -z=1 -i=3 -t=\"4m\" -o /lustremnt/ior/bw_n_to_n_rnd_buffered.testFile
Sequential buffered
mpirun --hostfile /home/azureuser/hosts.txt --map-by node -np 1600 /home/azureuser/ior -b=\"4g\" -F=1 -e=1 -d=5 -m=1 -i=3 -t=\"4m\" -o /lustremnt/ior/bw_n_to_n_seq_buffered.testFile
Random Direct block size variation blocksize -b 4g vs 128m and random access -z=1
mpirun --hostfile /home/azureuser/hosts.txt --map-by node -np 1600 /home/azureuser/ior  -b=\"4g\" -F=1 -e=1 -d=5 -m=1 -z=1 -i=3 -t=\"4m\" --posix.odirect=1 -o /lustremnt/ior/bw_n_to_n_rnd_direct.testFile
mpirun --hostfile /home/azureuser/hosts.txt --map-by node -np 1600 /home/azureuser/ior  -b=\"128m\" -F=1 -e=1 -d=5 -m=1 -z=1  -i=3 -t=\"4k\" --posix.odirect=1 -o /lustremnt/ior/iops_n_to_n_rnd_direct.testFile
Sequential Direct
mpirun --hostfile /home/azureuser/hosts.txt --map-by node -np 1600 /home/azureuser/ior -b=\"4g\" -F=1 -e=1 -d=5 -m=1 -i=3 -t=\"4m\" --posix.odirect=1 -o /lustremnt/ior/bw_n_to_n_seq_direct.testFile
This was the first in a series of posts that I'll be doing related to Azure Managed Lustre. Look for more posts on integrating with Azure Blob, Azure CycleCloud, and, of course, on any new features that we offer as they are available. Please let me know if you have any questions about this article or suggestions about any future articles in the comments below.
The team has been working hard to bring this service to our customers and we can’t wait to see what you do with it.
Thanks for reading and happy supercomputing!
Learn More
- Read the Azure Managed Lustre documentation
- Read our Azure Managed Lustre technical blog
- Visit our Azure HPC hub for more technical content developed for HPC
- Read about our Azure HPC + AI solution
#AzureHPC #AzureHPCAI


