This post has been republished via RSS; it originally appeared at: Microsoft Tech Community - Latest Blogs - .
This blog post is a collaboration between Nikhil Sira (Software Engineer), Rohitha Hewawasam (Principal Software Engineering Manager) and Kent Weare (Principal Product Manager) from the Azure Logic Apps team.
Introduction
We have recently published an update to how we emit telemetry for Application Insights in Azure Logic Apps (Standard). This new update is currently in Public Preview and is an opt-in feature for customers. It can be enabled without introducing risk to your telemetry. For customers who choose not to opt in, they will continue to emit telemetry using the existing method.
Benefits Summary
Based upon customer feedback, we had opportunities to improve the observability experience for Azure Logic Apps (Standard) by:
General
- Implemented consistency of names/Ids being used across different events and tables. These include:
- Workflow Id
- Workflow name
- Run Id
Requests table
- Reducing redundant data across tables.
- Reducing the amount of storage required by your Application Insights instance by moving key information from the trace table to the requests table. This avoids customers having to collect both sets of information to obtain a complete view of your workflow executions.
- Moving custom tracking ids and tracked properties from trace table to requests table.
- Making retry events easier to track.
- For trigger and action events, we now include the Trigger/Action type and the API name that allows you to query for the use of specific connectors.
Traces table
- Reduced the amount of verbosity in traces.
- Added meaningful categories and log levels to provide more flexibility with filtering.
- Workflow start/end records now stored in traces table.
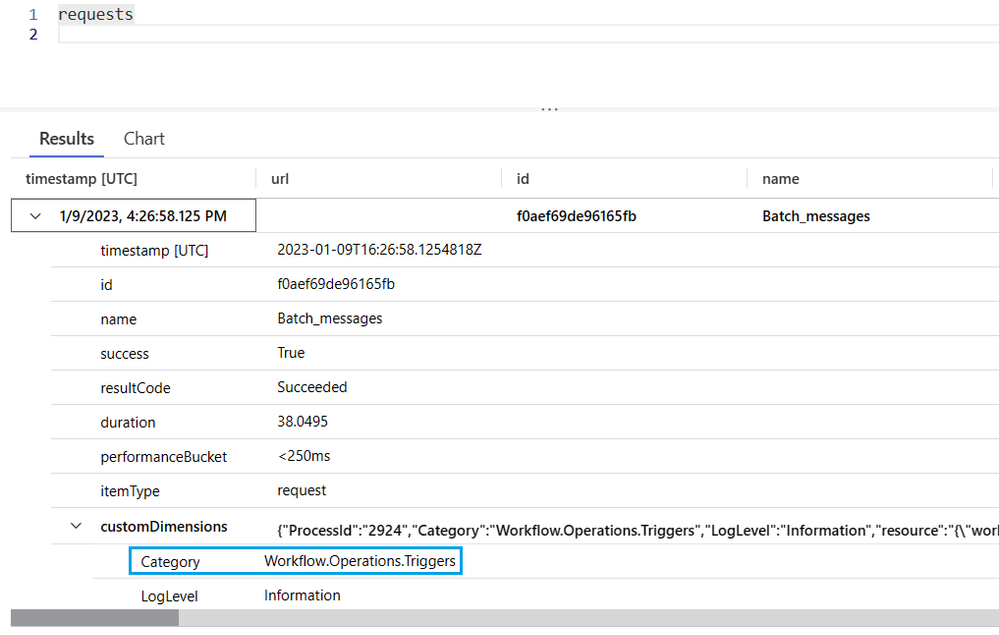
- Batch events are now emitted to this table.
- Events using a consistent id/name, resource, and correlation details.
Exceptions
- Making Exceptions more descriptive.
- Exceptions are now captured for action/trigger failures.
Filtering (at source)
- Advanced filtering that allows for more control over how events are emitted including: actions and triggers.
- More control over filtering non-workflow related events.
Metrics
- Improved consistency and filtering capabilities
For additional details on all these capabilities, please refer to the Scenario Deep dive below.
Prerequisites
To use the new Application Insights enhancements, your Logic App (Standard) project needs to be on the Functions V4 runtime. This automatically enabled from within the Azure Portal when you create a new Azure Logic App (Standard) instance or by modifying the Application Settings. Functions V4 runtime support is also available for VS Code based projects. For additional details on Functions V4 runtime support for Azure Logic Apps, please refer to the following blog post.
As mentioned in the introduction, this new version of Application Insights support is an opt-in experience for customers by modifying the host.json file of your Logic Apps (Standard) project.
To modify your host.json file from the Azure portal, please perform the following steps:
- Find Advanced Tools in your left navigation and then click on it. From there, click on the Go link.
- A new tab will open which will contain a set of Kudo tools. Click on Debug console and then CMD.
- Click on the site link.
- Next, click on the wwwroot link.
- Locate the host.json file and then click on the edit button.
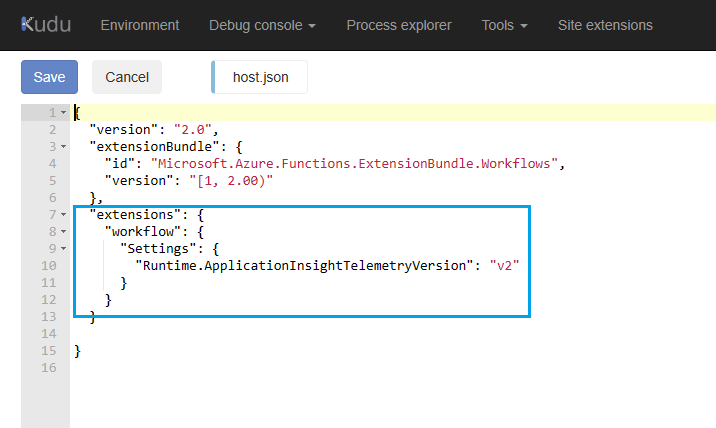
- Add the following JSON to this host.json file and then save this file.
- The extensions node enables this new version of Application Insights telemetry for Azure Logic Apps (Standard). If you do not specify this configuration, you will be using the previous version of Application Insights in your Logic App.
{
  "version": "2.0",
  "extensionBundle": {
    "id": "Microsoft.Azure.Functions.ExtensionBundle.Workflows",
    "version": " [1, 2.00) "
  },
  "extensions": {
    "workflow": {
      "Settings": {
        "Runtime.ApplicationInsightTelemetryVersion": "v2"
      }
    }
  }
}
Enabling Application Insights can also be configured from within a Logic Apps project in VS Code by editing the host.json file and including the following information.
Note: The configuration that was just discussed uses the default verbosity level of Information. Please see the Filtering section below for more options on how to filter our specific events at source.
Scenario Deep dives
Requests Table
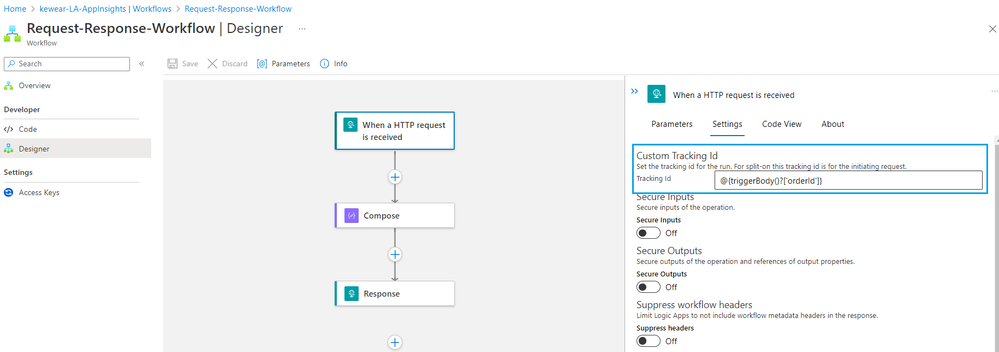
This is the primary table where you will find events for Azure Logic Apps (Standard). To highlight all the various fields tracked within this table, let’s use the following workflow to generate data. In addition, we will add a Custom Tracking id in our trigger which will pull an orderId from the body of the incoming message.
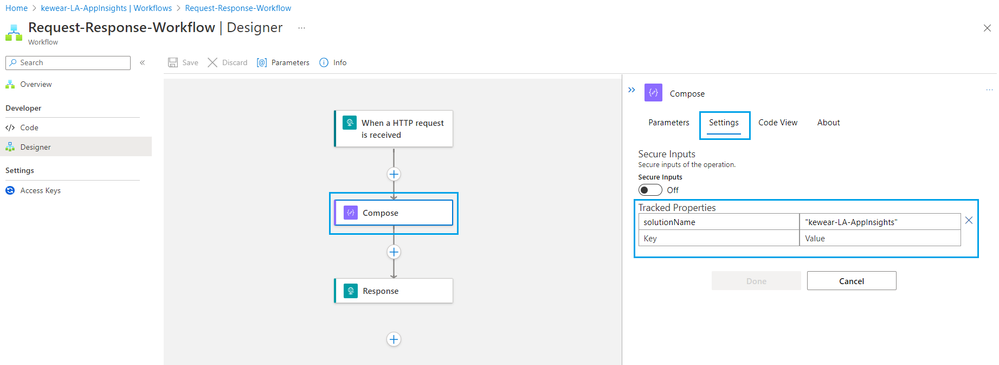
To demonstrate where tracked properties are stored, let’s set up a Tracked Property in our Compose action by clicking on Settings and then adding an item called solutionName with the name of our integration solution.
After we run this workflow and wait a couple minutes, we will see logs appear in our Application Insights instance by running the following query:
requests
| sort by timestamp desc
| take 10
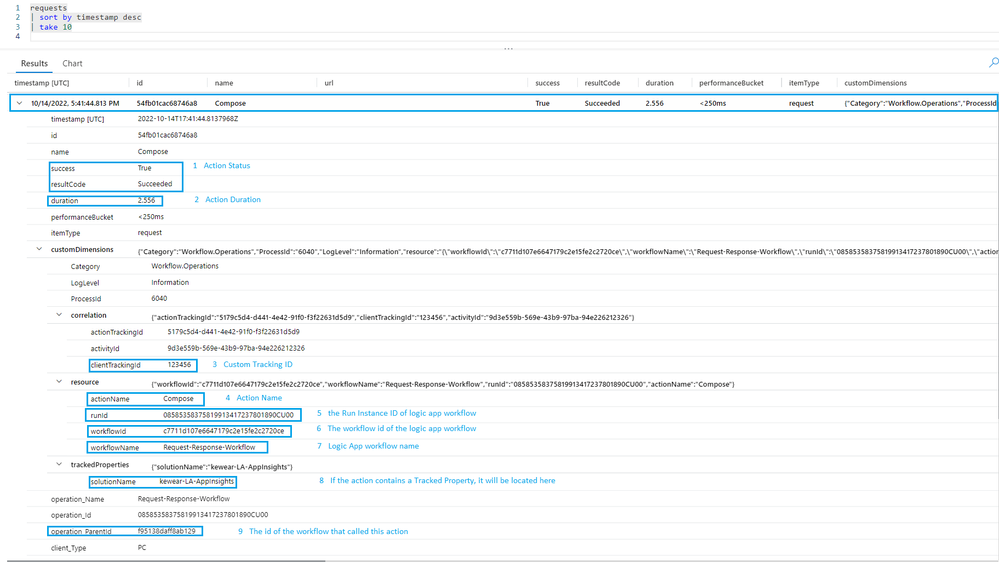
Let’s further explore our results. Please refer to the numbers in the following image that correspond with additional context below.
- We the trigger and all the actions that were part of our execution represented.
- There are two columns that are used to represent the status of that action/trigger execution. In this case we have a resultCode of 200 and a success value of True. In the event our trigger/action failed, these values will reflect this.
- The Duration of the event execution is captured in the duration column.
Next, let’s explore the record that represents our trigger.
- These two columns represent the status of our trigger. In this case the resultCode is Succeeded and therefor success is True. Should we have an error, our success value will be False.
- The duration of our trigger execution is captured.
- If a developer has specified a clientTrackingId as part of the trigger configuration, this value will be captured here.
- Within the triggerName field we will find the name of our trigger.
- The workflowName represents the name of our workflow that executed this trigger.
- The operation_Name, in this case, captures the name of our workflow that executed our trigger.
- We can link this trigger execution to our workflow execution through the operation_ParentId. If we look at the image from our workflow execution, we will discover that this value matches that of the id in that record.
Let’s now move to our Compose action to discover what data is being captured there.
- Much like we have seen with our trigger, we can observe the status of the action by looking at the success and resultCode values.
- Duration tracks the total time the action took to execute.
- If a clientTrackingId has been provided on the trigger, we can observe it here.
- ActionName is where we will find the name of our action that executed.
- RunId represents the logic app workflow run instance. This is the value that you will see in the Run History experience.
- The system identifier for our workflow is captured in the workflowId column.
- The name of our workflow that this action belongs to is captured in the workflowName column.
- If our action contains one or more tracked properties, we will find the values in the trackedProperties node.
- To link our action execution to our workflow’s overall execution, we can see this id being captured in the operation_ParentID column.
In addition to all the details we just went through, some common fields you may discover within the logs include:
Operation_ID: This represents the id for the component that just executed. Should there be exceptions or dependencies, this value should transcend those tables to allow us to link these executions.
Category: For Logic App Executions, we can expect this value to always be Workflow.Operations.Triggers or Workflow.Operations.Actions As we saw at the beginning of this post, we can filter the verbosity of logs based upon this category.
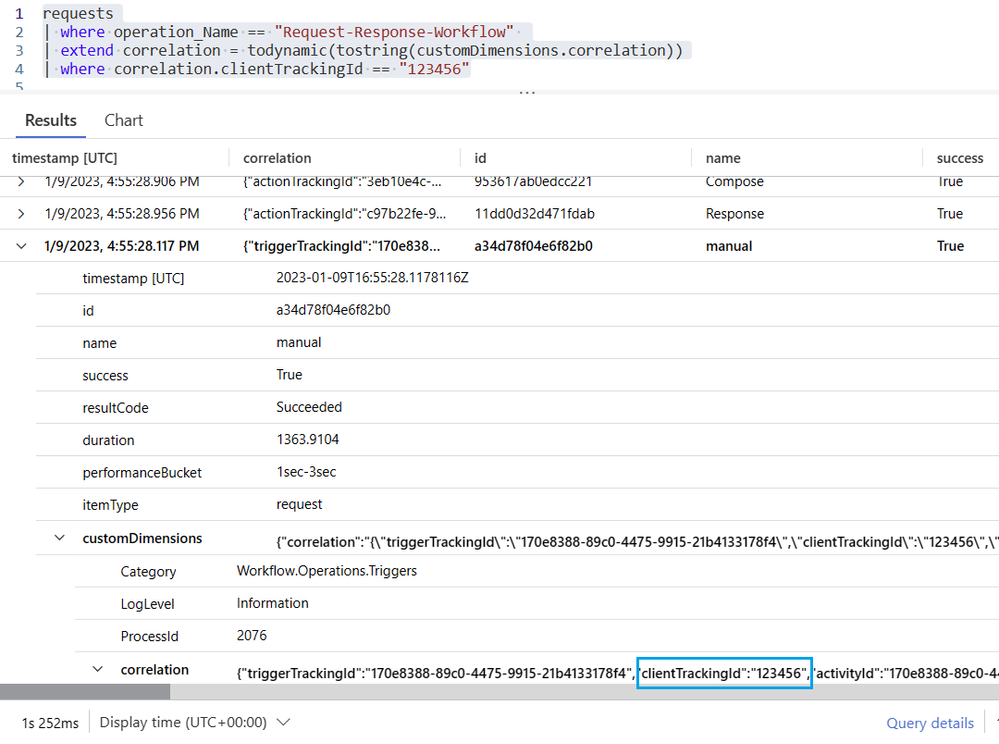
With the basics out of the way, here are a couple queries that you can use to query using Client Tracking Ids and Tracked Properties.
- Show me all requests with a specific workflow name and Client Tracking ID:
requests
| where operation_Name == "Request-Response-Workflow"
| extend correlation = todynamic(tostring(customDimensions.correlation))
| where correlation.clientTrackingId == "123456"
- Show me all requests with workflow name and specific tracked property value:
requests
| where operation_Name == "Request-Response-Workflow" and customDimensions has "trackedProperties"
| extend trackedProperties = todynamic(tostring(customDimensions.trackedProperties))
| where trackedProperties.solutionName== "kewear-LA-AppInsights"
Requests Table - Retries
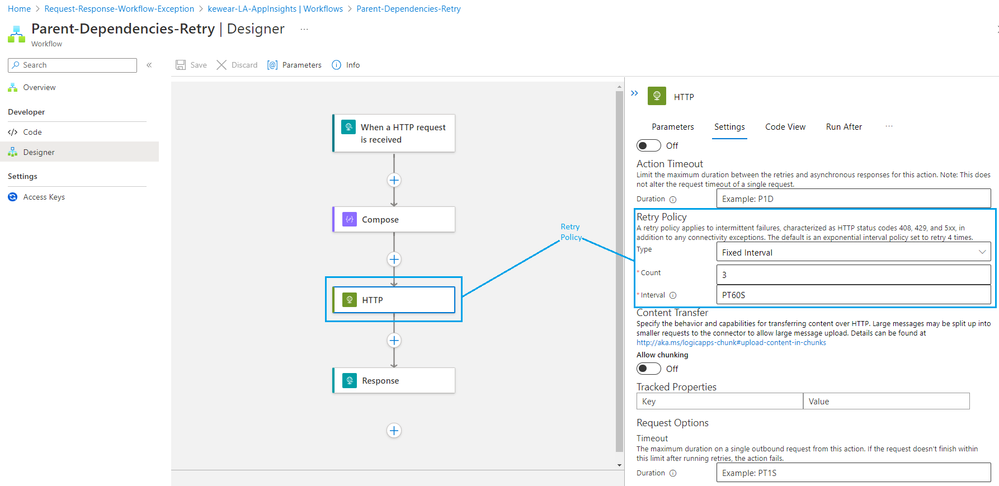
Another feature we have included in the Requests table is the ability to track retries. To demonstrate this, we can create a workflow that will call a URL that doesn’t resolve. We will also implement a Retry Policy within the workflow which will force retries. In the example below we will set this policy to be based upon a Fixed Interval that will retry 3 times, once per 60 seconds.
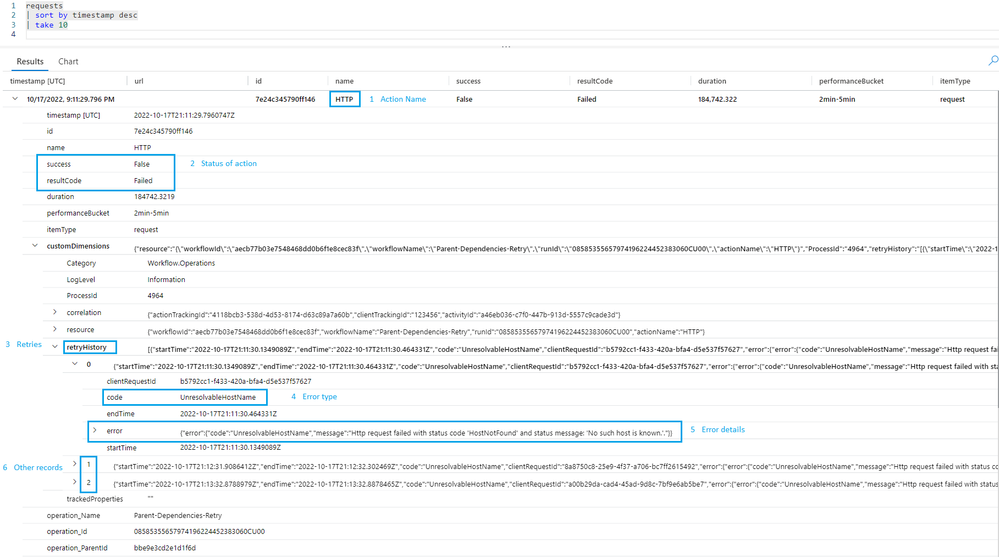
After executing our workflow, if we explore our Requests table once again, we will discover the following:
- A record for our HTTP action where we set our retry policy.
- Success and resultCode fields that represent the status of the action execution.
- A retryHistory that will outline retry details.
- Within our retryHistory record, a code that identifies the error type.
- More details about the error are provided.
- A record will appear for each retry that took place
Requests Table – Connector Usage
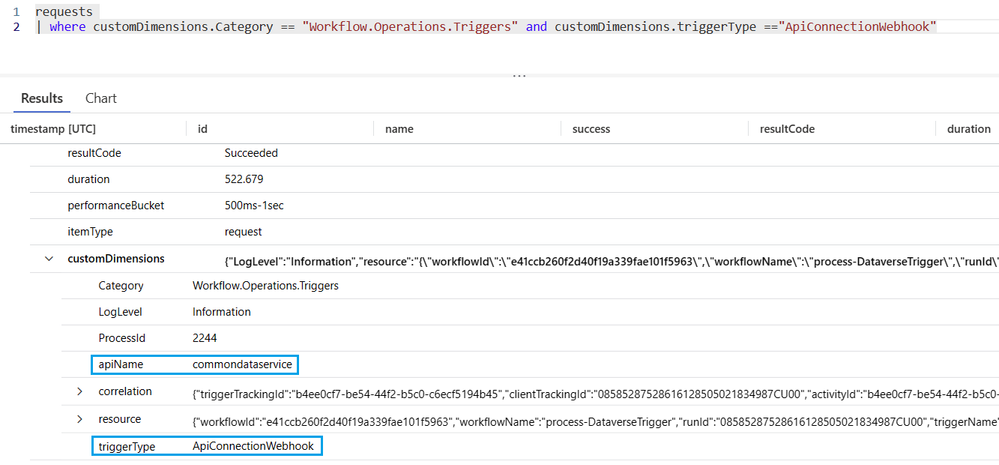
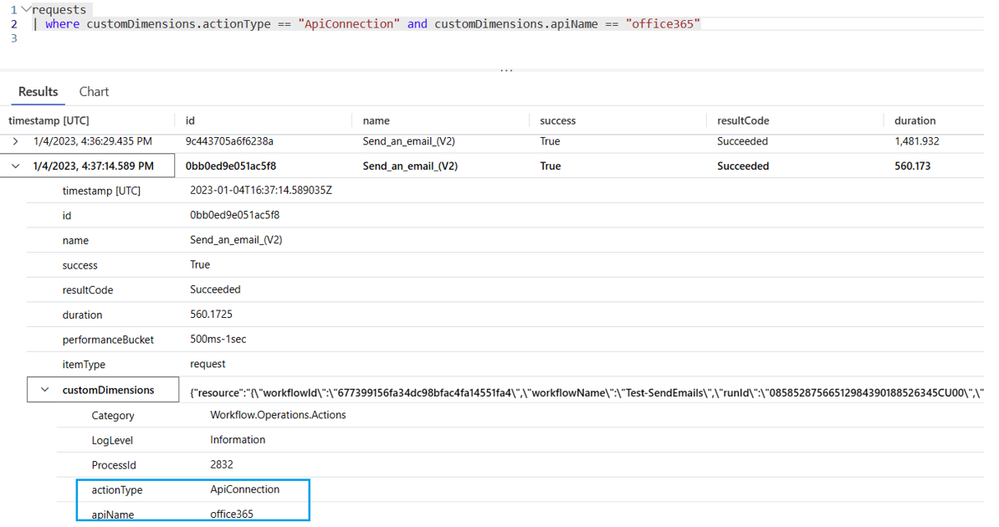
We now capture the name of the connector that participated in the trigger or action event that is captured within the Requests table.
- Querying for a specific trigger type. For example, if we are interested in finding events where the Dataverse connector is used, we can issue the following query:
requests
| where customDimensions.Category == "Workflow.Operations.Triggers" and customDimensions.triggerType =="ApiConnectionWebhook" and customDimensions.apiName =="commondataservice"
- Querying for a specific Action type. For example, if we want to identify requests where the Outlook 365 action has been used, we can run the following query:
requests
| where customDimensions.actionType == "ApiConnection" and customDimensions.apiName == "office365"
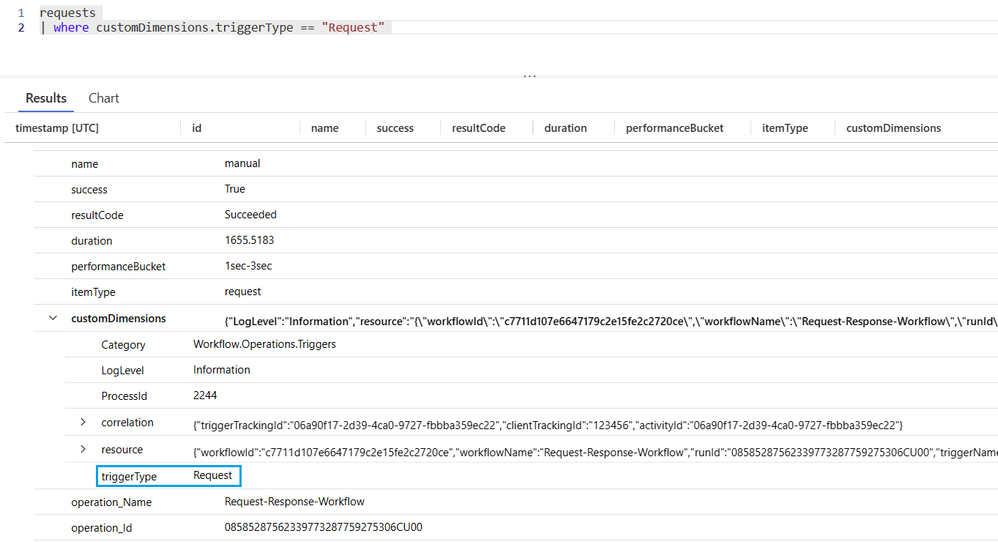
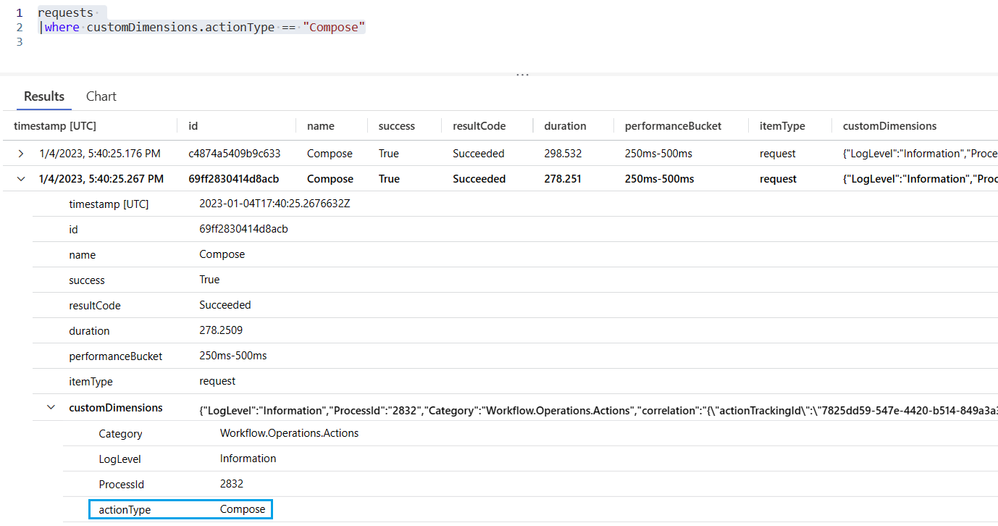
For both triggers and actions, we will differentiate between the types of connections that exist. You may see different behavior in the actionType and triggerType fields based upon whether it is an API Connection, API Webhook Connection, built in (like HTTP Request), or ServiceProvider.
For example, if we want to identify requests where the HTTP Request trigger has been used, we can run the following query:
requests
| where customDimensions.triggerType == "Request"
Similarly, we can find all the Compose actions that that exist by issuing the following query:
requests
|where customDimensions.actionType == "Compose"
Requests Table – Query for Trigger or Action Events
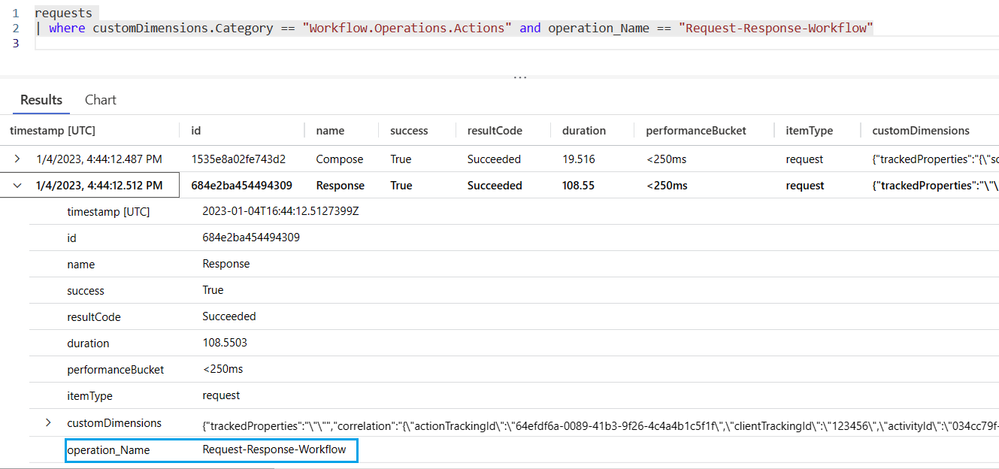
Since we now differentiate between trigger and action events, we can query for just a subset of events. For example, we may want to query for all actions for a specific workflow and can do so using the following query:
requests
| where customDimensions.Category == "Workflow.Operations.Actions" and operation_Name == "Request-Response-Workflow"
Similarly, we can also query for just trigger events for a specific workflow by executing the following query:
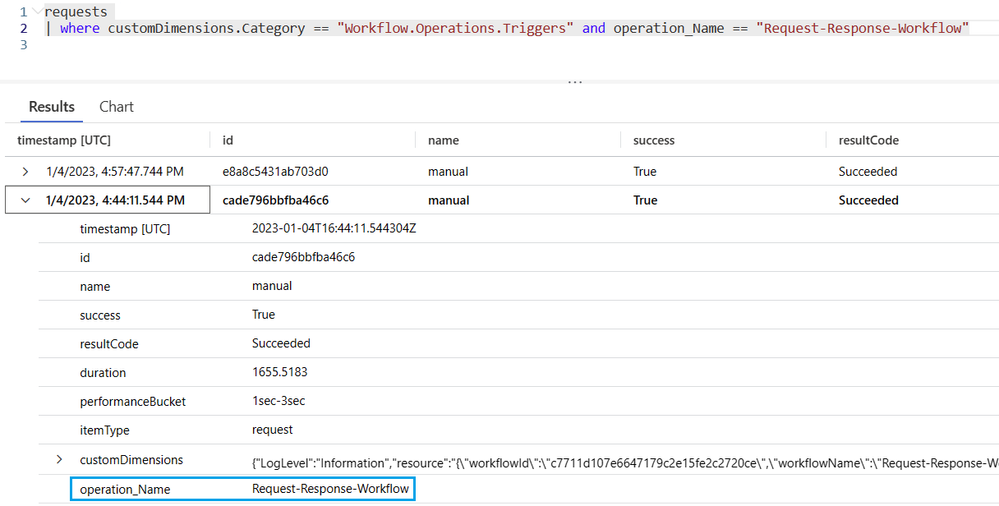
requests
| where customDimensions.Category == "Workflow.Operations.Triggers" and operation_Name == "Request-Response-Workflow"
Requests Table – Show me all Actions and Triggers associated with a Workflow Run Id
The run id is a powerful concept in Azure Logic Apps. Whenever you look at the Run History for a workflow execution, you are referencing a Run Id to see all the inputs and outputs for a workflow execution. If we want to perform a similar query against Application Insights telemetry, we can issue the following query and provide our Run Id:
requests
| where operation_Id =="08585287554177334956853859655CU00"
Traces Table: Workflow Run Start and End
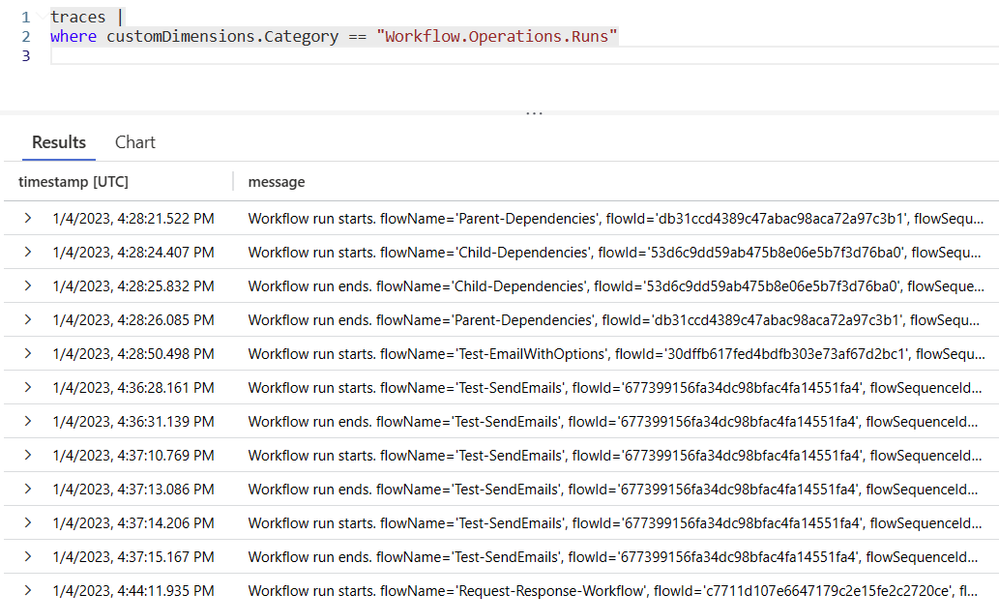
Within the Traces table we can discover more verbose information about workflow run start and end events. This information will be represented as two distinct events since a logic app workflow execution can be long running.
traces
| where customDimensions.Category == "Workflow.Operations.Runs"
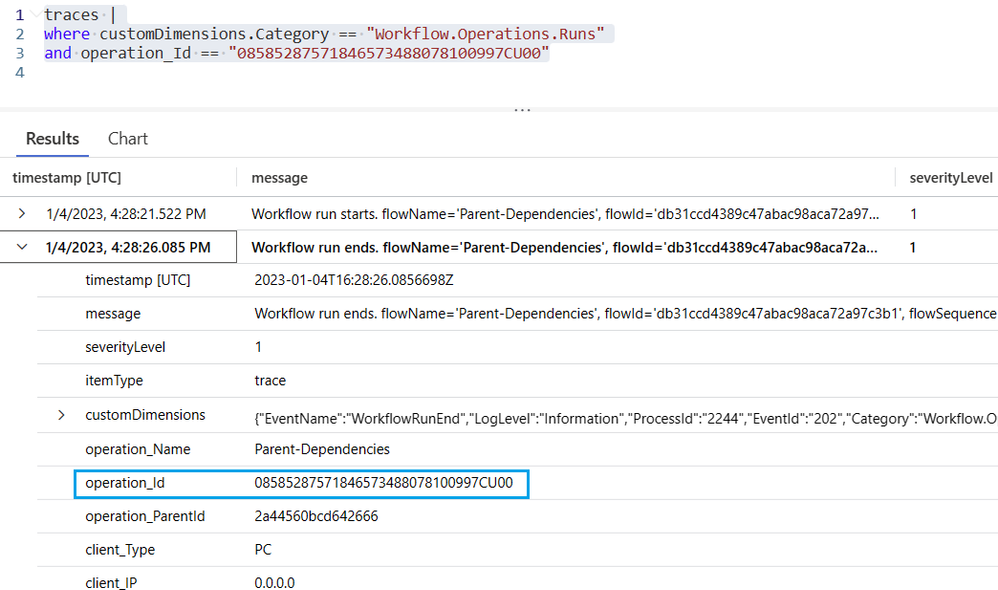
We can also further filter based upon our Run Id by using the following query:
traces
|where customDimensions.Category == "Workflow.Operations.Runs"
and operation_Id == "08585287571846573488078100997CU00"
Traces Table: Batch Send and Receive Events
Batch is a special capability found in Azure Logic Apps Consumption and Standard. To learn how to implement in Azure Logic Apps (Standard), please review the following blog post. As part of the telemetry payload, we have a category property that includes a value of Workflow.Operations.Batch whenever there is a send or receive Batch event. We can subsequently write the following query that will retrieve these events for us.
traces
| where customDimensions.Category == "Workflow.Operations.Batch"
Exceptions Table
We have made some additional investments to this table as well. Let’s run through an example of an exception to illustrate this. We will use a similar example to what we showed previously, the difference is that we will generate an exception within the Compose action by dividing by zero.
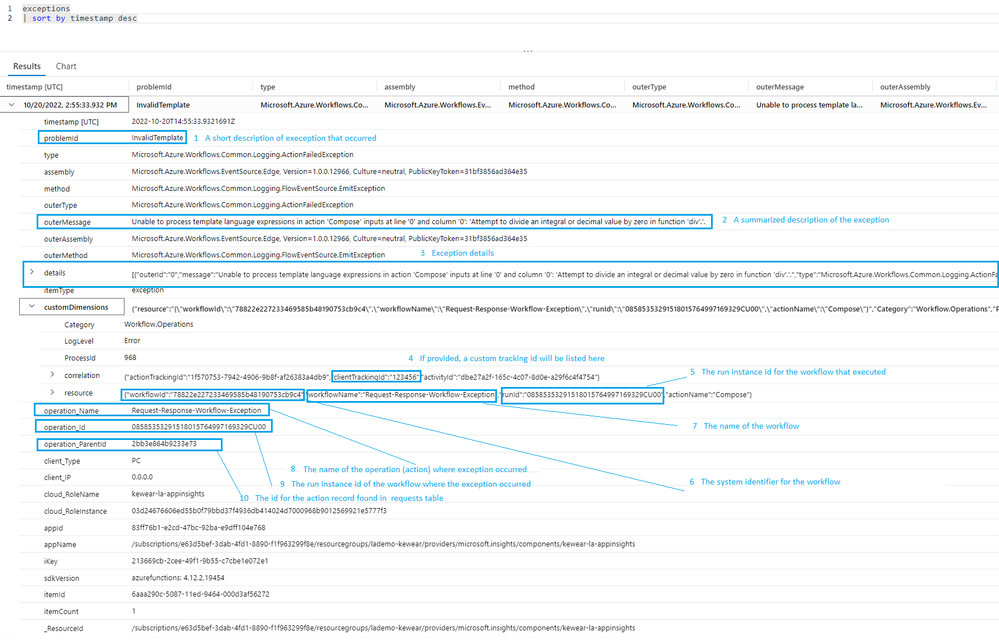
Let’s explore the type of information that is captured within this exception record:
- ProblemId represent a short description (exception type) of the exception that occurred.
- A more detailed description of the exception that occurred can be found in the outerMessage field.
- For more verbosity, look at the details node for the most complete information related to the exception.
- Should we have a clientTrackingId configured in their trigger, we can retrieve this value here.
- To determine the instance of our workflow that ran, we can find this value in the runId field.
- Our system identifier for our workflow can be found in the workflowId field.
- The name of our workflow that experienced an exception can be found in the workflowName field.
- The name of the action that failed can be found in the operation_Name field.
- This is the same value as our workflows run instance id, allowing you to link the execution of that workflow run with this exception record.
- To link our action’s id record found in the requests table. We can see this id being captured in the operation_ParentID column.
Dependencies Table
Dependency events are emitted when you have one resource calling another when both of those resources are using Application Insights. In the context of Azure Logic Apps, it's typically a service calling another service by using HTTP, a database, or a file system. Application Insights measures the duration of dependency calls and whether it's failing or not, along with information like the name of the dependency. You can investigate specific dependency calls and correlate them to requests and exceptions.
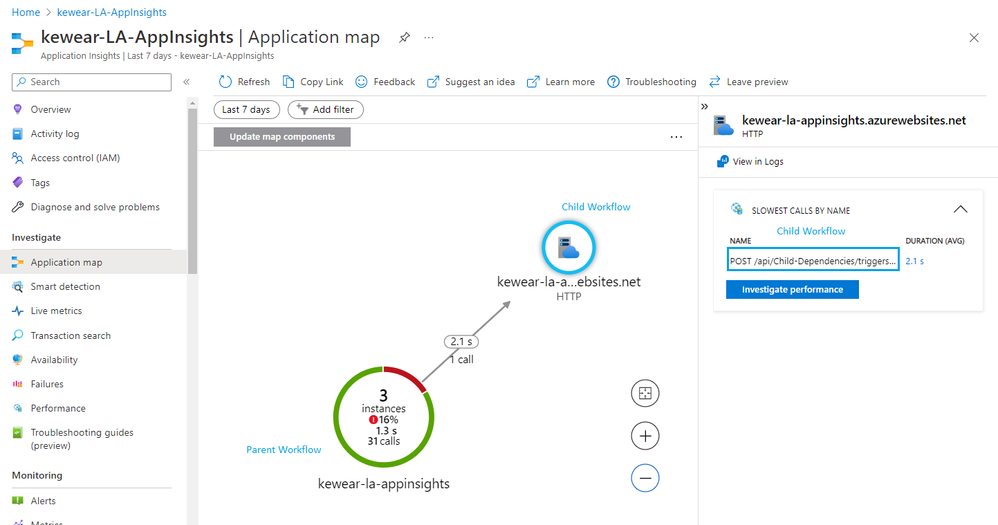
To demonstrate how dependencies work, we will create a parent workflow that calls a child workflow over HTTP.
We can run the following query to view the linkages between our parent workflow and the dependency record created for the child workflow.
union requests, dependencies
| where operation_Id contains "<runId>"
When we look at the results we will discover the following:
- Our query will bring together data from both the requests and dependencies table. Our operation_Id will provide the linkage between these records.
- Since we have a common attribute between these two tables, we will see all the actions from our parent workflow and then a dependency record.
- You can distinguish where the record is coming from based upon the itemType column.
- The operation_ParentId has the same value as the HTTP action’s id allowing us to link these records together.
Another benefit of this operation_Id is providing a linkage between our parent workflow and our child workflow is the Application Map that is found in Application Insights. This linkage allows for the visualization of our parent workflow calling our child workflow.
Filtering
There are generally two ways to filter. You can filter by writing queries as we have previously discussed on this page. In addition, we can also filter at source by specifying criteria that will be evaluated prior to events being emitted. When specific filters are applied at source, we can reduce the amount of storage required and subsequently reduce our operational costs.
A key attribute that determines filtering is the Category attribute. You will find this attribute within the customDimensions node of a request or trace record.
For Requests, we have the following attributes that we can differentiate between and associate different verbosity levels:
|
Category |
Purpose |
|
Workflow.Operations.Triggers |
This category represents a request record for a trigger event |
|
Workflow.Operations.Actions |
This category represents a request record for an action event |
For each of these categories we can independently set the verbosity by specifying a logLevel within our host.json file. For example, if we are only interested in errors for actions and trigger events, we can specify the following configuration:
{
"logging": {
    "logLevel": {
      "Workflow.Operations.Actions": "Error",
      "Workflow.Operations.Triggers": "Error",
    }
  }
}
For additional information about logLevels, please refer to the following document.
When it comes to the traces table, we also have control over how much data is emitted. This includes information related to:
|
Category |
Purpose |
|
Workflow.Operations.Runs |
Start and end events that represent a workflow’s execution |
|
Workflow.Operations.Batch |
Batch send and receive events |
|
Workflow.Host |
Internal checks for background services |
|
Workflow.Jobs |
Internal events related to job processing |
|
Workflow.Runtime |
Internal logging events |
Below are some host.json examples of how you may choose to enable different verbosity levels for trace events:
- Show me only warning/error/critical traces for Host, Jobs and Runtime events:
{
"logging": {
    "logLevel": {
      "Workflow.Host": "Warning",
      "Workflow.Jobs": "Warning",
      "Workflow.Runtime": "Warning",
    }
  }
}
- Keep default log level to warning and show up to information level only for Runs/Actions/Triggers:
{
"logging": {
    "logLevel": {
     "default": "Warning",
      "Workflow.Operations.Runs": "Information",
      "Workflow.Operations.Actions": "Information",
      "Workflow.Operations.Triggers": "Information",
    }
 }
}
Note: If you do not specify any logLevels, the default of Information will be used.
Metrics
Through the investments that were made in enhancing our Application Insights schema, we are now able to gain additional insights from a Metrics perspective. From your Application Insights instance, select Metrics from the left navigation menu. From there, select your Application Insights instance as your Scope and then select workflow.operations as your Metric Namespace. From there, you can select the Metric that you are interested in such as Runs Completed and an Aggregation like Count or Avg. Once you have configured your filters, you will see a chart that represents workflow executions for your Application Insights instance.
If you would like to filter based upon a specific workflow, you can do so by using filters. Filters require multi-dimensional metrics to be enabled on your Application Insights instance. Once that is enabled, subsequent events can be filtered. With multi-dimensional metrics enabled, we can now click on the Add filter button and then select Workflow from the Property dropdown, followed by = as our Operator and then select the appropriate workflow(s).
Using filtering will allow you to target a subset of the overall events that are captured in Application Insights.
Conclusion
As demonstrated, we have simplified the experience of querying, accessing, and storing observability data. This includes providing customers with more control on what events and their verbosity are emitted, allowing customers to reduce storage costs. We also ensure consistency when emitting events by using a consistent id/name, resource, and correlation details.
Feedback
If you would like to provide feedback on this feature, please leave a comment below and we can connect to further discuss.
Video Walk-through
To see a view walk-through of this content, please check out the following video.


