This post has been republished via RSS; it originally appeared at: IIS Support Blog articles.
How to capture network traces on Azure App Services (Windows & Linux)
Azure App Service Windows:
-
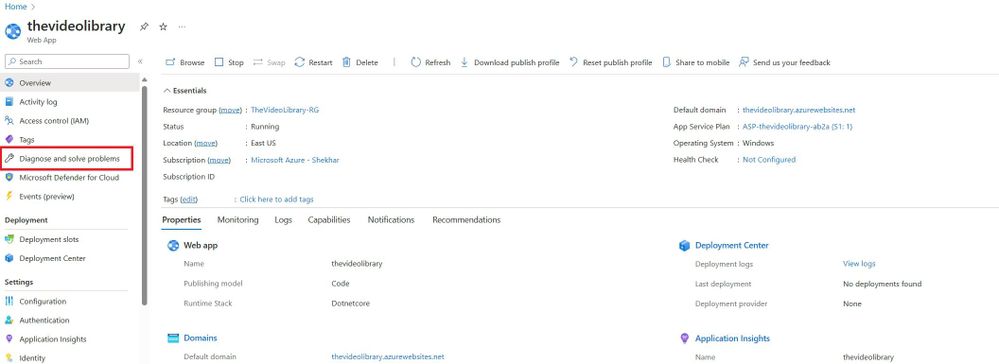
On App Service Page on Azure Portal, select “Diagnose and Solve Problems”:
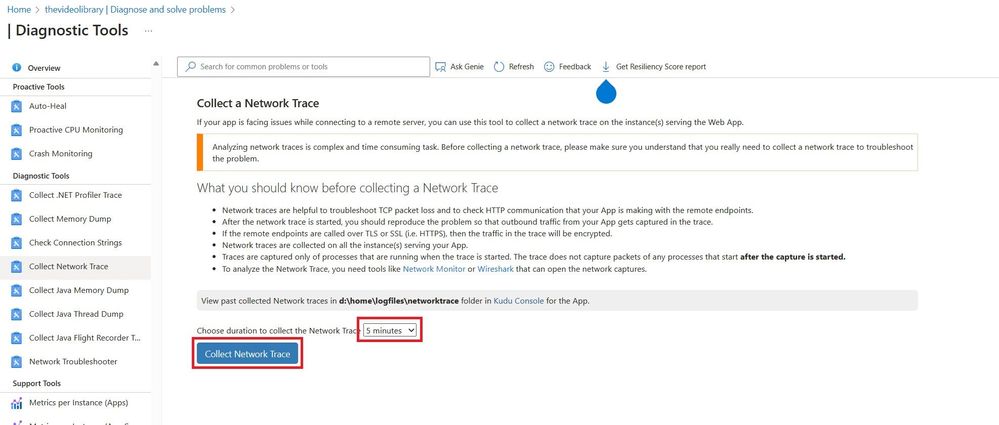
- In the search box, type "Collect Network Trace" and select "Collect Network Trace"
- Choose the duration and click on Collect Network Trace button:
-
The timer started and the portal will show you the countdown before the trace will automatically stop:
How to open the trace file:
-
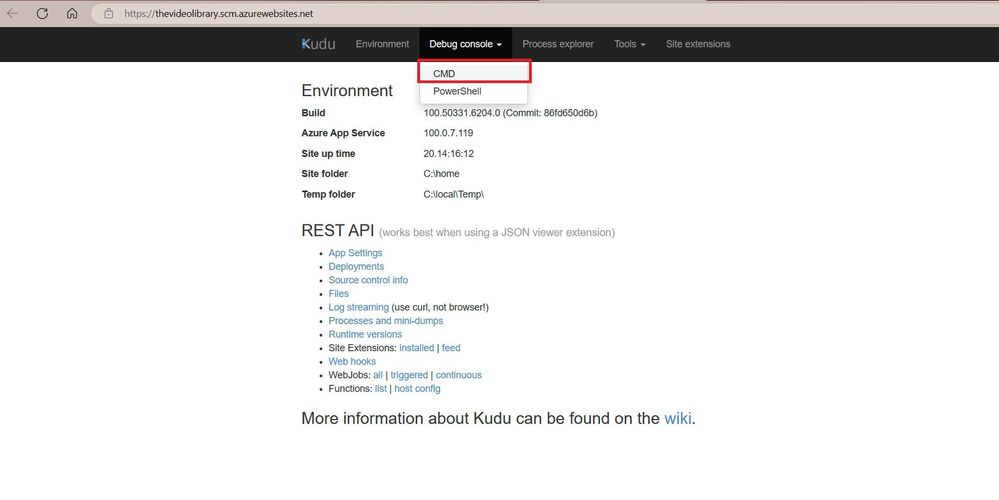
On your Browser, go to Kudo console (https://webappname.scm.azurewebsites.net) --> Debug console --> CMD , as below:
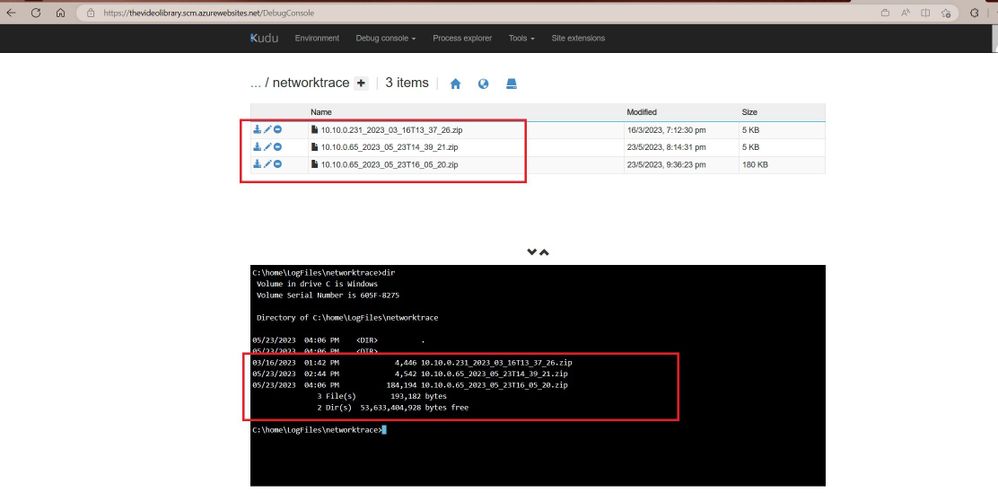
A new Zip file will be created, you can download the trace file (cap file) on your machine as below screenshots:
Azure App Service Linux:
Use the tcpdump tool to collect the network trace.
- In most Linux systems, tcpdump tool is pre-installed. If the tool is not installed, install it with the following command:
- yum install tcpdump
- Determine the name of the active network adapter using any of the commands below.
- tcpdump -D
- ip -a
- ifconfig
- Collect the network packets and save them in a pcap file
-
tcpdump -w /tmp/0001.pcap -i en0
Where:- /tmp is the location where we want to save the capture
- 0001.pcap is the name of the capture file
- en0 is the name of the active adapter derived in Step 2
- Reproduce the issue.
- Use Ctrl+C to stop the capture.
- Collect the /tmp/0001.pcap and send it for analysis.


