
This post has been republished via RSS; it originally appeared at: Microsoft Edge Blog.
On the Microsoft Edge team, we spend a lot of time working with product teams across Microsoft to support them in building great web experiences, and jointly raising the bar for how these apps perform for everyone, whatever device they may use. In this post, we’ll review some new DevTools capabilities we have recently built in partnership with the Office Performance team, which enable concrete performance improvements in production web experiences. There are many ways to measure the complexity of a web app and its code base, but when it comes to performance, the following indicators tend to play an important role:- The number of nodes in the DOM tree.
- The number of stylesheets and CSS rules in the document.
- The number of HTTP requests, and the total size of the transferred data on page load.
Reducing CPU sampling overhead by 95%
Earlier this year, the Office team was investigating the launch performance of the PowerPoint web app, which uses multiple out-of-process iframes. While doing so, they noticed significant CPU usage overhead while recording profiles in the Performance tool of Edge DevTools. In fact, in some instances, DevTools was seemingly responsible for saturating an engineer’s 10 core CPU while profiling. Using Event Tracing for Windows (ETW), the team determined that this was due to the way the CPU profiler in Chromium (the browser engine which Edge is built on) was doing its sampling. In summary, it was using a busy waiting approach which meant constantly running code even while waiting for the next event.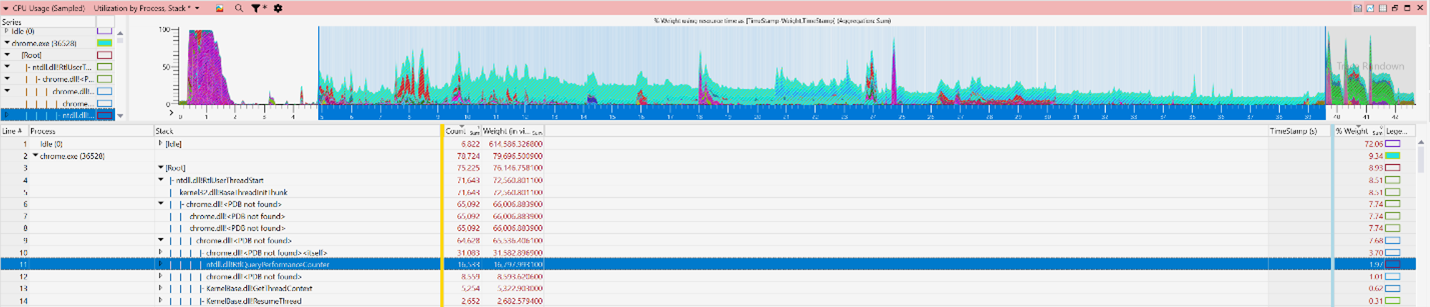 Under normal circumstances, the overhead would have been negligible, but with the many processes that PowerPoint used, it was starting to become a problem.
By using a more accurate sleep timing method, the team was able to reduce the CPU sampling overhead by 95% and decrease the total CPU consumption from Edge by 71% while profiling.
Of course, this helped the PowerPoint team investigate and improve the load performance of their app, but this also means that everyone using the Performance tool in DevTools (in Edge or any Chromium browser) now has a much better experience.
Under normal circumstances, the overhead would have been negligible, but with the many processes that PowerPoint used, it was starting to become a problem.
By using a more accurate sleep timing method, the team was able to reduce the CPU sampling overhead by 95% and decrease the total CPU consumption from Edge by 71% while profiling.
Of course, this helped the PowerPoint team investigate and improve the load performance of their app, but this also means that everyone using the Performance tool in DevTools (in Edge or any Chromium browser) now has a much better experience.
Simplified source maps everywhere you need them
We're also working to improve the quality and reliability of the Performance tool with better support for source maps. Source maps are used in DevTools to map your production code (often bundled and minified) back to your original source code. While source maps have been available in the Sources tool for a while, we’ve added support for them in the Performance and Memory tools too. The Performance tool now automatically shows un-minified function and file names, which makes investigating slowdowns in your apps a lot easier.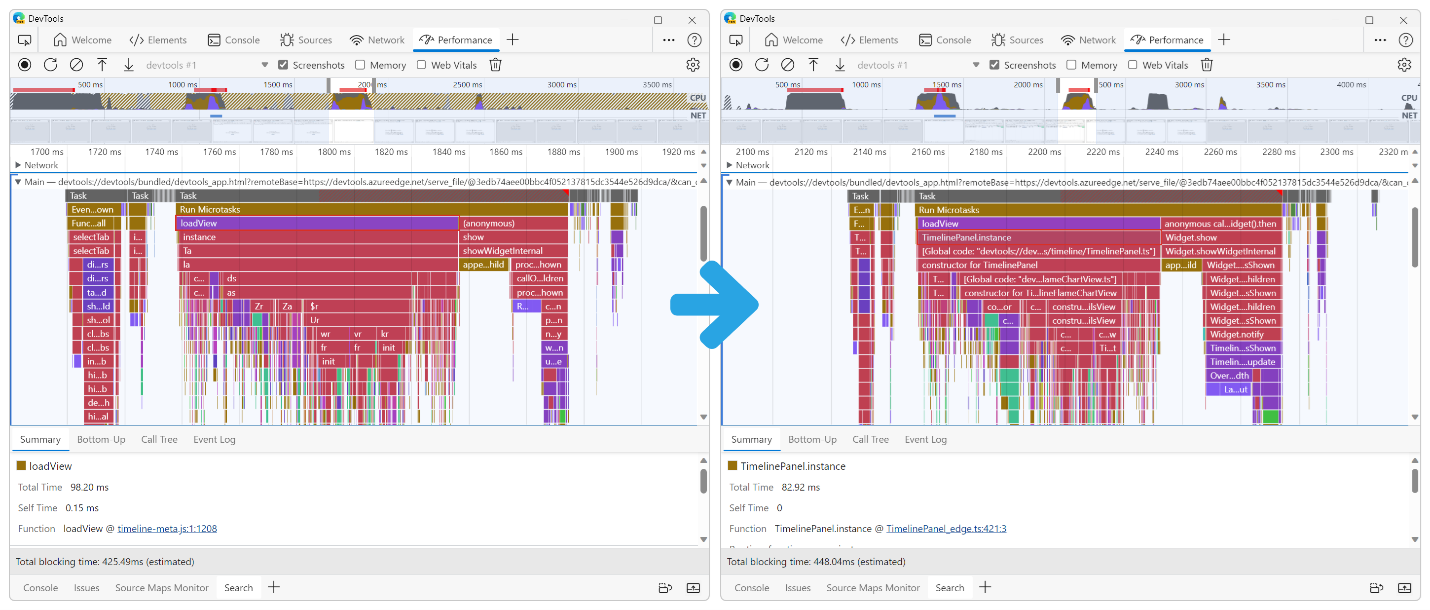 On top of this, we've added support Azure Pipelines, which makes publishing source maps during your build process a lot simpler. You can now generate and publish your source maps to the symbol server and then securely retrieve them in DevTools. This makes getting source maps a lot easier in DevTools; all you need to do is either login to your Azure Active Directory from DevTools, or enter an ADO access token.
Being able to see original function names in the Performance tool has already helped us many times. For example, it helped us spot several easy wins while investigating and improving the load time of PowerPoint.
It would have been nearly impossible to find as many of these function calls as we did with a minified profile. When working on a complex codebase, there can be thousands of other minified functions calls in a performance profile, but seeing the original function names made it a lot easier to recognize bad patterns.
On top of this, we've added support Azure Pipelines, which makes publishing source maps during your build process a lot simpler. You can now generate and publish your source maps to the symbol server and then securely retrieve them in DevTools. This makes getting source maps a lot easier in DevTools; all you need to do is either login to your Azure Active Directory from DevTools, or enter an ADO access token.
Being able to see original function names in the Performance tool has already helped us many times. For example, it helped us spot several easy wins while investigating and improving the load time of PowerPoint.
It would have been nearly impossible to find as many of these function calls as we did with a minified profile. When working on a complex codebase, there can be thousands of other minified functions calls in a performance profile, but seeing the original function names made it a lot easier to recognize bad patterns.
Beyond JavaScript performance
When performance improvements are needed, the first wins often come from working on the app’s JavaScript code. But JavaScript isn’t the only thing that a browser needs to run in order to render a webpage. One very important thing is rendering the pixels on the screen. This requires computing the styles of all elements, figuring out the layout of the page, and painting those pixels. JavaScript can still be a culprit here, as it’s often what causes the browser to re-render the page in the first place. But the speed at which the browser does render it depends on how many DOM nodes there are to re-render, how many CSS rules apply to them, and even sometimes on the complexity of the CSS selectors that apply to them (see The truth about CSS selector performance for more information). The Office Performance team was investigating ways to improve responsiveness in Microsoft Word. While doing so, they noticed a 75ms style recalculation event that was making the launch of the app slower than it could be. Style recalculation events are when the browser engine needs to figure out what just changed in the page, often as a result of a DOM mutation, then collect the CSS styles that apply to the changed elements and compute their values.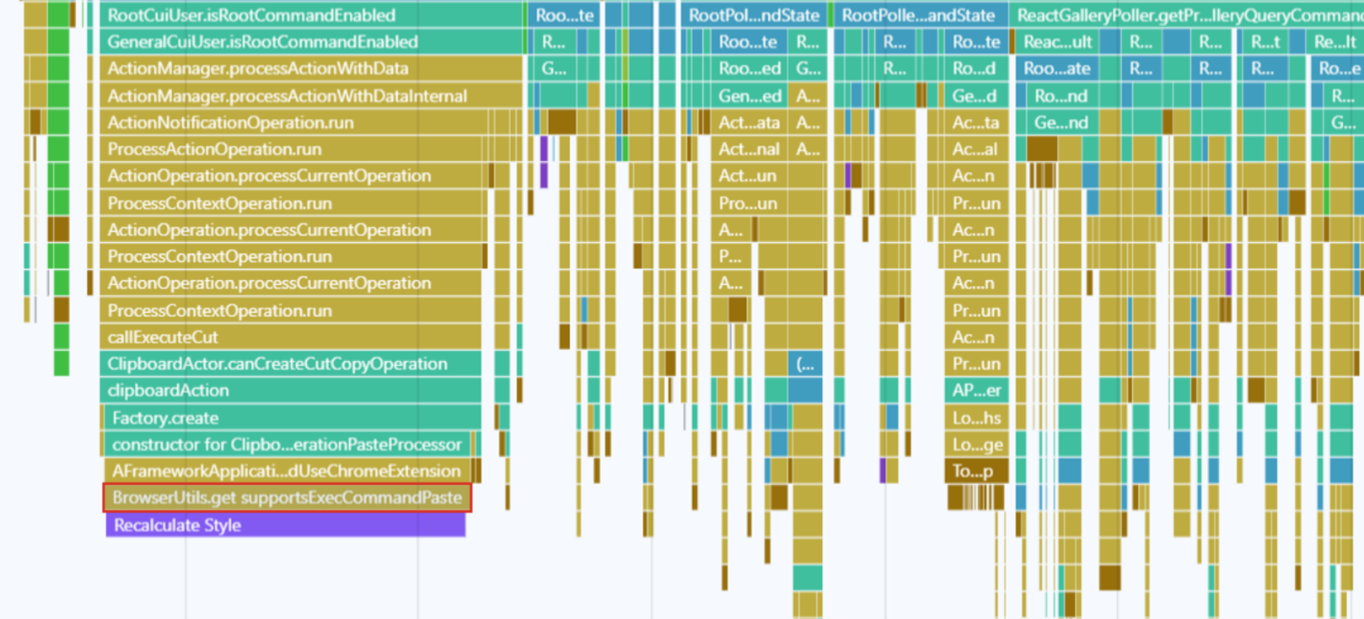 Thanks to source maps support in the Performance tool, it was obvious that the cause for this long style recalculation event was, in fact, a JavaScript function that checked if pasting text was supported. It was then easy to go back to the code and do the same check in a way that didn’t cause such a long style recalculation.
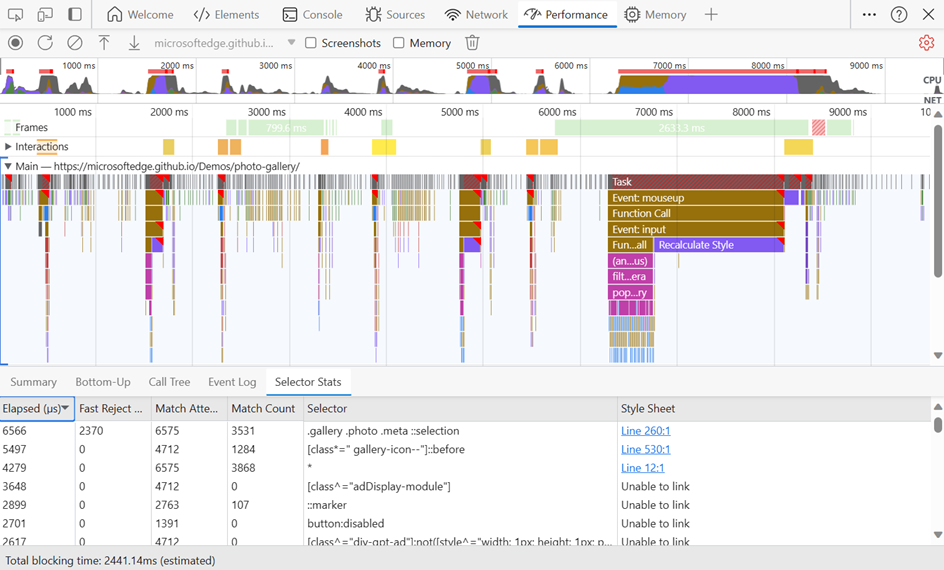
It’s not always possible to avoid a style recalculation event or move it to a less inconvenient time. Sometimes, these events just need to happen and all we can do is try to make them happen as fast as possible. That’s why we recently shipped Selector Stats, a feature that helps you discover which CSS selectors may have a negative impact on the time it takes the browser to recalculate some styles.
With Selector Stats, you get aggregate statistics for your CSS selectors. This means you can see the statistics for all the style recalculation events in a performance profile.
Thanks to source maps support in the Performance tool, it was obvious that the cause for this long style recalculation event was, in fact, a JavaScript function that checked if pasting text was supported. It was then easy to go back to the code and do the same check in a way that didn’t cause such a long style recalculation.
It’s not always possible to avoid a style recalculation event or move it to a less inconvenient time. Sometimes, these events just need to happen and all we can do is try to make them happen as fast as possible. That’s why we recently shipped Selector Stats, a feature that helps you discover which CSS selectors may have a negative impact on the time it takes the browser to recalculate some styles.
With Selector Stats, you get aggregate statistics for your CSS selectors. This means you can see the statistics for all the style recalculation events in a performance profile.
A slew of memory improvements
The previous improvements were all about helping make apps faster to load and to run. But we also spend a lot of time making sure our apps have as small a memory footprint as possible. And again, we work together across teams, to invent and implement the tools that can make our lives easier. Here are some of the improvements we’ve made to the DevTools’ Memory tool that have helped us already, and that may be useful to you too:- The Memory tool can now load much larger heap snapshot files: when memory gets out of control and a memory leak investigation is needed, it helps if the tool can deal with large amounts of data.
- We also made recording large heap snapshots much faster. Generating large heap snapshots that weigh over 1GB is now 70% to 86% faster.
- We made it possible to compare two heap snapshots by their retainer paths. For applications with a size and complexity that’s comparable to the Microsoft 365 web apps, this makes finding memory leaks much easier. You can now see what top level objects are growing in retained size.
- Navigating large memory heap snapshots is also easier now with the ability to filter snapshopts by node types.
In the end, it’s all about teamwork
At the center of all these new DevTools features and Microsoft product improvements, we're working to leverage our close relationships with some of the industry's most powerful web apps to ensure that developer tooling is up to the task. Working across teams is a superpower that we very often use to overcome challenges. When you put your heads together, there really isn’t anything you can’t do. Performance and memory issue investigations, in particular, are hard to do on your own. So, to close, let me introduce one last DevTools feature that’s all about teamwork: Enhanced Traces. We made sharing performance and memory recordings with other people much better with Enhanced Traces. With Enhanced Traces, performance and memory recordings now preserve a lot more data than previously possible. These traces include more information, such as the messages in the console, the JavaScript code that was running on the page at the time of recording, and the DOM nodes. This means that if you record a performance profile on your own machine, and then export it as an Enhanced Trace, you can send the trace to a coworker, and when they open it on their machine, they’ll see what you see. The same DOM nodes, the same console messages, the same scripts, and obviously the same performance profile. We hope these features help you create faster and leaner web applications. As always, we value your feedback about Edge DevTools. If you have any thoughts, questions, feature requests, or problems related to these features, or anything else in DevTools, please file an issue on our GitHub repository.
Happy debugging!
We hope these features help you create faster and leaner web applications. As always, we value your feedback about Edge DevTools. If you have any thoughts, questions, feature requests, or problems related to these features, or anything else in DevTools, please file an issue on our GitHub repository.
Happy debugging!