This post has been republished via RSS; it originally appeared at: Microsoft Tech Community - Latest Blogs - .
The most common way to load test applications is to simulate a specific number of virtual users. But what if you want to test the system to make sure it can handle a desired number of requests per second (RPS) ? For example, you may want to load test a payment gateway service for the number of transactions that can be processed every second. RPS or throughput is a crucial metric that reveals fundamental information about the tested system. Every system has a critical point in terms of throughput. Once the system reaches the critical point, it might keep the throughput around the same level, but the response times go up or the requests get throttled.
In this article you’ll learn how to:
- Create and run a load test for a desired RPS by using Azure Load Testing and the JMeter Throughput Shaping Timer plugin.
- Use the test run dashboard and server metrics to identify the application bottlenecks.
Configure your script to load test a target RPS
The Throughput Shaping Timer plugin in JMeter enables you to set the shape of desired RPS . RPS need not be constant throughout the test and can vary over time based on your requirement. For example, you may want to start with a slow ramp up, hold the load for a while and then increase it to a higher load to stress the application.
Let’s create a test script to demo the possibilities of the plugin.
- Add a Thread Group to the Test Plan in JMeter.
In the Thread Group - provide the duration of the test and the number of threads. You may wonder how many threads you should run to achieve the desired RPS. Thread pool size can be calculated as RPS * <max response time> / 1000. The higher your desired rate, the more threads you will need. The more response time service has the more threads you will need.In this example, the service response time is 3 milliseconds (ms) and the target RPS is 4000, i.e. we would like to test if our service can handle 4000 requests per second, with the max response time being 3ms. The thread pool size would be 4000 * 3 / 1000 = 12 threads. You can have some additional threads for buffer capacity. we’ve added 15 threads.
A few points to note:
- While using the Throughput Shaping Timer, make sure that you specify enough threads as if the number is not high, JMeter would not be able to generate the target throughput.
- Make sure the specified thread count is not too high as it may result in a spike in throughput at the end of the test while JMeter is shutting all the threads.

- Add a sampler to the thread group. In the case, we have added an HTTP request and configured the target URL, parameters, request body etc.
- Add a Throughput Shaping Timer to setup the RPS schedule. This timer will delay requests automatically to achieve our target RPS load level.
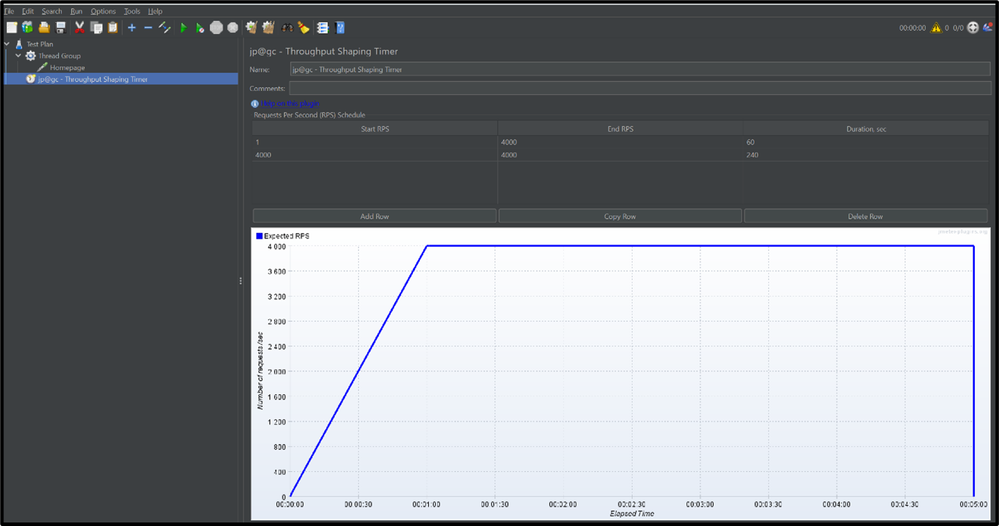
- Set the RPS schedule (as shown below) to first ramp-up to the target RPS and then hold the RPS for the remaining duration of the test. This would look like:
Start RPS: 0; End RPS: 4000; Duration, sec: 60
Start RPS: 4000; End RPS: 400; Duration, sec: 240
JMeter starts with 0 RPS and increases to 4000 RPS in the first 60 secs. After that the RPS is maintained constantly at 4000 for the remaining 240 seconds

Run the test with Azure Load Testing
Create a test using the JMeter script in Azure Load Testing and run the test. The Throughput Shaping Time plugin is automatically enabled on Azure Load Testing, no further configuration is needed.
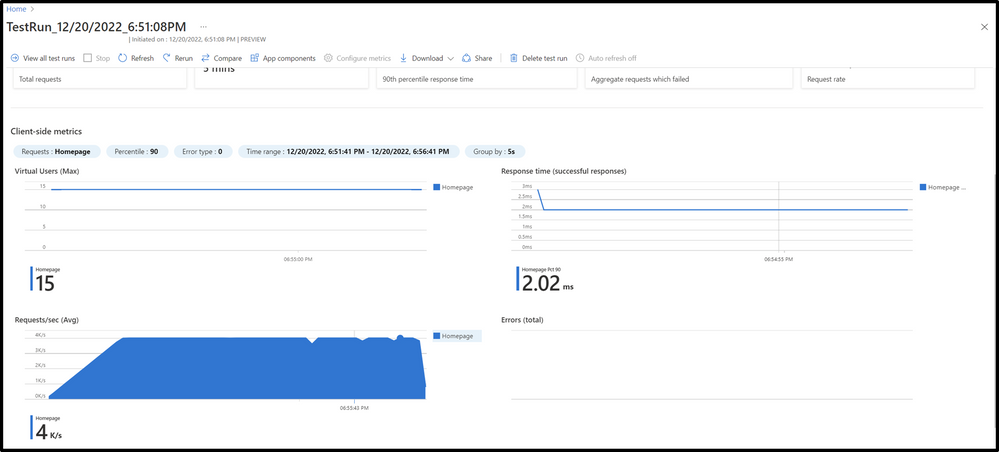
As you run the test, you can see (in the below screenshot) that the Throughput Shaping Timer tries to maintain the RPS schedule throughout the test and achieve the target.

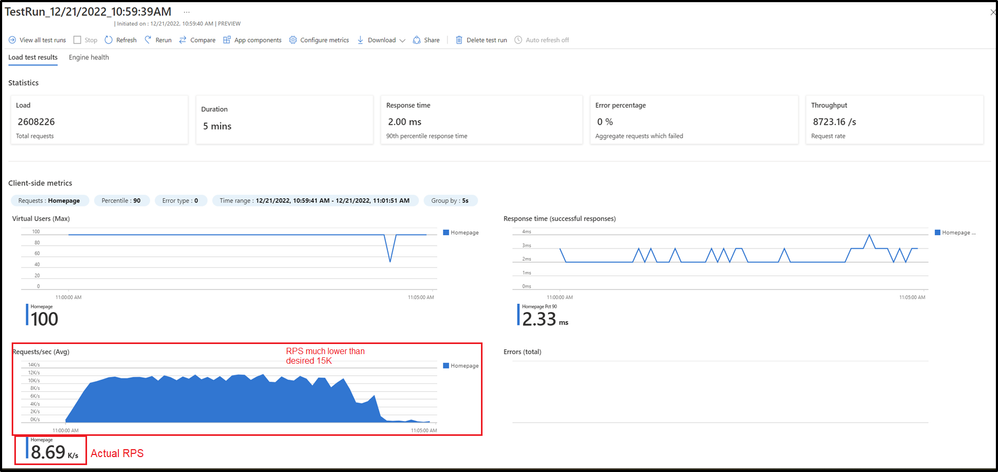
If the server is not able to handle such a load, the throughput will be lower. You can monitor the server-side metrics in Azure Load Testing to help you identify the bottlenecks of your application. In our example, we tried to achieve a target of 15000 RPS. However, the app could not handle this throughput, resulting in the actual RPS to be much lower.

Looking at the server-side metrics for my application, we find that the Memory utilization for the App Service was high (>60%). This means, we may need to upgrade the App Service Plan to achieve a higher throughput. Identifying the bottlenecks enables you to take preventive measures to ensure your application can give you the desired throughput during peak load.

Using the Throughput Shaping Timer, we were able test for a desired requests per second (RPS) and identify the bottlenecks in our application. You can now test your application and ensure that it is able to handle the desired number of requests per second.
What else are you waiting for? Try it out and let us know if you were able to test your system for the desired throughput with Azure Load Testing. You can follow this tutorial to learn everything that you need start running a load test on Azure Load Testing and identify performance bottlenecks.
If you have any feedback on Azure Load Testing, let us know through our feedback forum. Refer to the previous blogs on Azure load testing here.
Happy Load Testing…!
