
This post has been republished via RSS; it originally appeared at: Microsoft Edge Blog.
Performance is essential to your success, which makes it core to ours. To help ensure the browser doesn’t slow you down, we always keep performance in mind as we continue to improve Microsoft Edge. However, for the times that your browser isn’t running as expected, we want to help you understand how Microsoft Edge is using the resources on your device and when Microsoft Edge’s resource usage is unusually high so you can get back to what you want to get done.How Microsoft Edge thinks about memory usage
The memory usage of a browser can be looked at in many ways and is dependent on several factors. Here, for Microsoft Edge, the memory metrics that we are most interested in are commit and private working set. Commit is the total amount of private memory allocations made by a process. Each process’s commit is separate, or private to the process. These allocations may reside in random access memory (RAM), or in the page file on your hard drive. The page file is a reserved portion of your hard drive that is used as an extension of RAM for data that hasn’t been used recently. When in RAM, the commit is either in the private working set, or on lists the OS uses to manage memory, like the modified, or standby list. Commit can be seen in either the Browser Task Manager or the Windows Task Manager.- Browser Task Manager – The “Memory” column shows the commit size for a process (Figure 1).
- Windows Task Manager – The “Commit size” column shows the commit size for a process. This column can be added to the Details tab (Figure 3).
- Windows Task Manager – The “Memory” column in the Processes or Details tab shows the private working set for the process (Figure 3).
Factors that impact memory usage
When investigating Microsoft Edge’s memory usage, we typically want to use commit, as that is the metric under the browser’s control. The total commit size is determined by many factors, among the most prominent are the number of tabs, extensions and ads, web page content, screen resolution, and number of browser windows.- Number of tabs, ads, and extensions – Generally, each tab, ad, and extension is a separate process. The more tabs/ads open and extensions enabled, the more processes and the more memory required, as each process’s commit is separate, or private to the process.
- Content – The memory usage for a tab, ad, or extension is dependent on content, with things like pictures, video, and audio using more, and often substantially more memory, than text.
- Screen resolution and window size – The higher the screen resolution or the larger the window, the more content that is displayed, and allocations of memory required to display the content will increase. This will impact the GPU process the most and can impact the memory size of pictures and videos in the tabs as well.
- Number of browser windows – Separate windows result in additional allocations of memory to display content because more are visible concurrently. This will impact the GPU process the most.
Commit
When we start to look at the commit size of different processes, it’s helpful to understand how the factors listed above impact the commit size for each process and how the size can vary. Below you will find values typically representing the upper end of each processes’ commit size, as determined by diagnostic data sent to Microsoft Edge, as well as factors that impact each processes’ commit size.- Browser process – This process manages the tabs and implements common infrastructure. The commit for this process typically won’t exceed 400 MB. More tabs will push this process’ commit to the higher values.
- Renderer process – The commit for each of these processes typically won’t exceed 500 MB. Complex content that plays video or has large scrollable areas, such as social media news feeds, will have commit at the higher end of the range.
- Subframe process – These are also renderer processes, but are not for the main content, and are most frequently used for things like ads. The commit for each of these processes typically won't exceed 75 MB. However, complex ads that play video or do slide shows can sometimes consume more.
- GPU process – The commit for this process typically won’t exceed 1.75 GB. More tabs, browser windows, and higher screen resolution will have commits at the higher values.
- Utility process – The commit for each of these processes typically won’t exceed 30 MB.
- Extension processes and plug-in processes – The commit for each of these processes typically won’t exceed 150 MB.
- Open Browser Task Manger
- Right click on a browser window title bar and click “Browser task manager”, or press Shift-Esc after you’ve clicked on your browser window
- Look at the “Memory” column for each process
- If the number in the “Memory” column is greater than one of the expected ranges listed above, please submit feedback through Microsoft Edge
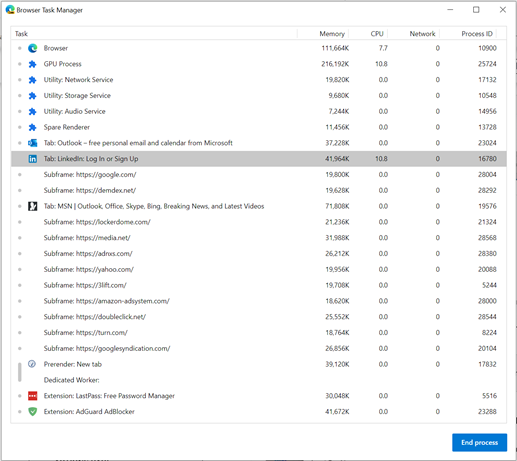 Figure 1: Browser Task Manager[/caption]
Private working set
The size of your private working set is dependent on many factors, including RAM size, other processes present on the system, which process is available for keyboard or mouse interactions, age of the process, and which background processes are playing audio/video. The private working set will never be larger than the process commit. The commit for a process will be distributed in four places, private working set, modified, standby, and the page file. Typically, browser processes that have more than 80% of commit in the private working set, and that are not the active tab (i.e. the tab that is available for keyboard or mouse interactions), would be considered excessive, unless your device has a large amount of RAM (64 GB of RAM or more). Background tabs will have varying percentages of their commit in their private working set. How much is dependent on the system RAM size and the private working set of other processes on the system. Tabs that are in the background for extended periods (several hours or more) or are sleeping will have only a small percentage of their commit in private working set. However, private working sets can remain high (> 50% of commit) for the lifetime of the process on systems that have substantial amounts of available memory (64 GB of RAM or more) in Standby and Free, as shown by the Windows Resource Monitor (Figure 2). You can open Windows Resource Monitor by typing “Resource Monitor” in the Windows search box in the bottom left-hand corner of your desktop. [caption id="attachment_24639" align="aligncenter" width="624"]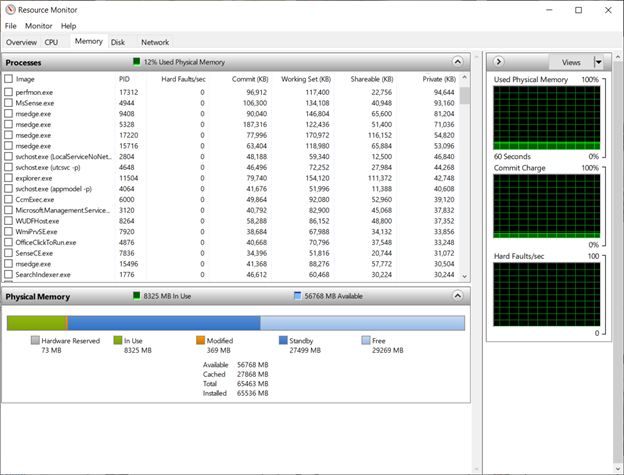 Figure 2: Windows Resource Monitor[/caption]
The best method to display the browser processes private working set is via the Windows Task Manger as shown in Figure 2. To display your private working set, follow the steps below:
Figure 2: Windows Resource Monitor[/caption]
The best method to display the browser processes private working set is via the Windows Task Manger as shown in Figure 2. To display your private working set, follow the steps below:
- Open Windows Task Manager (press Ctrl-Shift-Esc or type “Task Manager” in the Windows search box in the bottom left-hand corner of your desktop.)
- Click on the “Details” Tab in Windows Task Manager
- Ensure you have the necessary columns showing
- Right click on the header that has “Name”, “Status”, “User Name”, “CPU”, etc.
- Click “Select columns”
- Make sure that you have check marks next to “PID”, “Commit size”, and “Memory (private working set)”
- Click OK
- Open Browser Task Manager (right click on a browser window title bar and click “Browser task manager”, or press Shift-Esc after you’ve clicked on your browser window)
- For the process that you are interested in, look at the value in the “Process ID” column
- Return to Windows Task Manager and under the “PID” column, find the value that matches the value in Browser Task Manager
- Looking at that row, compare the values under the columns Memory (private working set) and “Commit size”
- If a process’s private working set is greater than 80% of your commit, please submit feedback through Microsoft
- Note: Make sure that the process you are looking at is not the active tab, the tab that is available for keyboard or mouse interactions, and verify that your system doesn’t have 64 GB or more of RAM
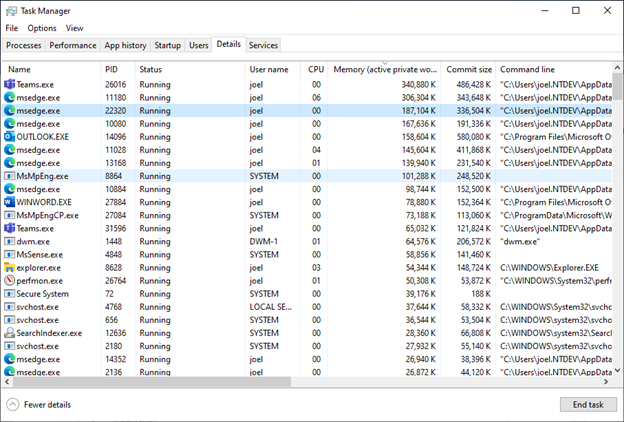 Figure 3: Windows Task Manager[/caption]