This post has been republished via RSS; it originally appeared at: Azure Data Explorer articles.
The ADX Web Explorer results grid is not just our way to display your query results, but it is a powerful data exploration tool set, that allows you to create various views of your data and quickly draw insights.
Become more productive today! Read this article to learn how it works.
In this article you'll learn how to use the following result grid productivity tools:
- Expand cell and JSON format
- Expand row
- Column grouping
- Column filters
- Cell to query filter
- Pivot mode
- Cell statistics
Get set, ready, go!
Expand Cell
When dealing with long strings or dynamic fields such a JSON, cell expand functionality comes in handy.
Double clicking a cell opens an expanded view that allows you easily read long strings, and provides a JSON formating for dynamic data.
You can choose between 3 reading pane modes for expanded view, inline (like in above picture), right pane, and bottom pane. Use the icon on the top right of the result grid to switch reading pane modes.
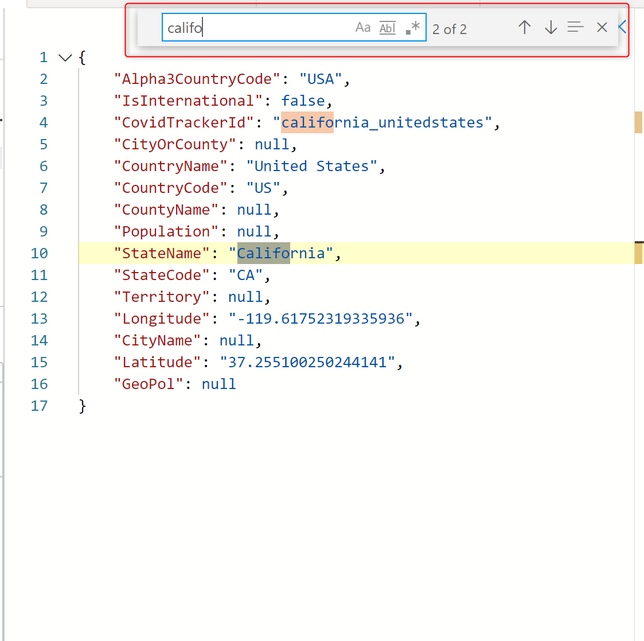
The expanded mode is dynamic, allowing you to expand and collapse array items, and supports full in cell search. to search in a dynamic cell, expand it and hit ctrl+f to search it’s contents (in the image below expanded view is opened in right pane mode):
Expand Row
When approaching a table with dozens of columns it can save you time to expand the entire row for a single glance overview of the different columns and their content. I can assure you it beats endless scrolling to the right.
Click on the arrow (>) on the left of every row to expand it.
Expand row view is optimal when used with right reading pane mode.
Column grouping
Column level grouping allows you to run a quick on-the-fly analysis on your query results by grouping the results table by distinct values of the selected column.
To use column grouping mouse-over a column, select the menu, and select Group by <column name>.
The table will be grouped by distinct values of the selected column. Double-click a group or click on the arrow (>) on the right of each group to expand the grouping to display related records.
This feature is great for exploratory analysis.
To reset the grid to its original state mouse-over the Group column, then select Reset columns.
Column filters
The ADX column filter feature introduces a powerful set of multi condition filters to allow you create complex filter logic on your pre-rendered results.
To use column filters mouse-over a column, select the menu, and then select the filter icon.
In the filter builder select the desired operator:
Now type in the expression you’re wish to filter the column on (note that the filter is not case sensitive)
To create a multi-condition filter select a boolean operator to add additional condition
Results are filtered as you type in.
To remove the filter simply delete the text from your first filter condition.
Cell content to query filter
Another easy way to filter the grid, is to add a filter operator to the query directly from the grid.
Select a cell with content you wish to create a query filter for.
Right click to open the cell actions menu. Select Add selection as filter
A query clause will be added to your query in the query editor:
Pivot mode
Pivot mode feature is somewhat similar to Excel’s pivot table, enabling you to do advanced analysis in the grid itself.
Pivoting allows you to take a columns values and turn them into columns. For example you can pivot on State to make columns for Florida, Missouri, Alabama, etc.
Pivoting only makes sense when mixed with aggregation. If you turn a column into a pivot column, you must have at least one aggregation (value) active for the configuration to make sense. For example, if pivoting by State, you must provide something you are measuring such as ‘DamageProperty' per state.
To enable it click on the Columns menu on the right
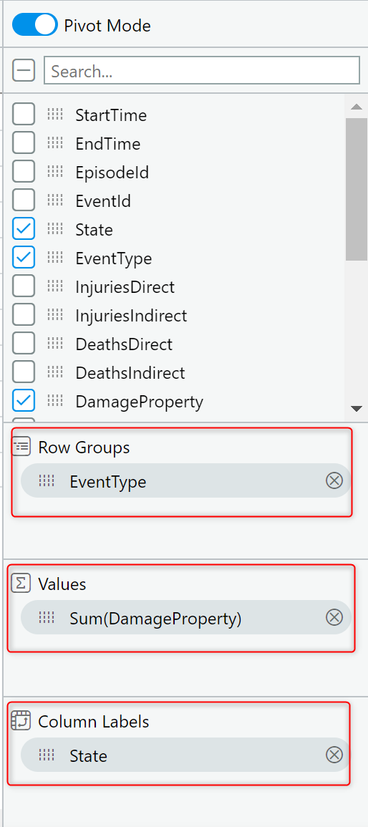
Now select Pivot Mode and drag and drop columns into the appropriate fields below:
- Row Groups – allows grouping by different columns.
- Values – aggregated data (supports SUM operator).
- Column labels – allows turning column values into columns and enables another level of grouping.
The result should look like the following pivot table;
Sum of all damage to property grouped by event type and displayed per country:
Search in results
Search in results enables you to look for a specific expression within the entire results table.
Click on the Search button on the right and type in the expression you’re looking for.
All mentions of your searched expression are now highlighted in the table. You can navigate between them by clicking Enter to go forward or Shift+Enter to go backward, or you can use the up and down buttons next to the search box.
Cell statistics
Cell statistics helps you to run quick calculations on numeric data in your grid.
Calculations such as MIN, MAX, AVG, SUM and COUNT.
To use this feature, select a few numerical cells. The grid allows you to select multiple rows, columns, and cells.
The calculated statistics will appear on bottom right of the grid.
Want to learn more about the ADX Web Explorer and have a hands on training?
Use this guide to learn more.


