This post has been republished via RSS; it originally appeared at: Core Infrastructure and Security Blog articles.
Hi all,
A customer of mine recently reported an issue that some workstations sporadically lock while the user is working and asked if we could figure out the culprit. Here is the story.
First let me mention that Konstantin Chernyi, a Microsoft CE colleague from Russia, contributed greatly here. So credits also go to him (thanks, Konstantin).
Before we start you need to understand a few basics. A workstation is usually locked by calling the User32.dll function User32dll!LockWorkStation (https://docs.microsoft.com/en-us/windows/win32/api/winuser/nf-winuser-lockworkstation). There may be other options but most applications rely on this function. LockWorkStation creates the LogonUI.exe process to display the Logon Screen and the Lock Screen (if configured). It’s also important to know the Lock events can be traced using the Microsoft-Windows-WinLogon provider. You can get a list of all installed providers by running the command
XPerf is a good choice to narrow down this type of sporadic issue. It supports circular file mode, which means it can overwrite old events to keep the file size at a specified maximum (important for long runs). It can also capture the stack to support stackwalking, so we can see functions that processes call (if symbols are loaded). XPerf is part of the Windows Performance Toolkit, which in turn is part of the Windows Assessment and Deployment Kit (Windows ADK). You can download the ADK here: https://docs.microsoft.com/en-us/windows-hardware/get-started/adk-install.
In Windows 10, Windows Performance Recorder (wpr.exe) is built-in and could be an alternative to XPerf (https://docs.microsoft.com/en-us/windows-hardware/test/wpt/author-a-custom-recording-profile). In this blog, however, I’m going with XPerf.
1. Create the trace
I asked the customer to run the following command in an elevated command prompt on a client that was affected by the sporadic locks:
This starts two ETW sessions: A kernel trace with some kernel providers to capture process and thread creation, image load and unload events, CPU samples, and the stack. The output file should stay at 256 MB (-maxfile, -filemode circular). The second trace captures events of the Microsoft-Windows-WinLogon provider which includes the Lock event.
After that the customer created a scheduled task, which triggers on the lock workstation event (luckily, we have this predefined trigger) with a delay of 3 seconds. This task runs the command to stop the trace and merge the trace files.
Note that the two subsequent “-stop” are not a mistake. Remember that we created two ETW sessions?
2. Analyze the trace
To open the Lock.etl file, I use Windows Performance Analyzer (WPA). I originally worked with the Lock.etl file uploaded by the customer, but for this blog post I simulated this issue to avoid posting screenshots with customer data. The simulation was done by calling RunDLL32.exe User32.dll,LockWorkStation, which makes RunDLL32.exe the “evil” process.
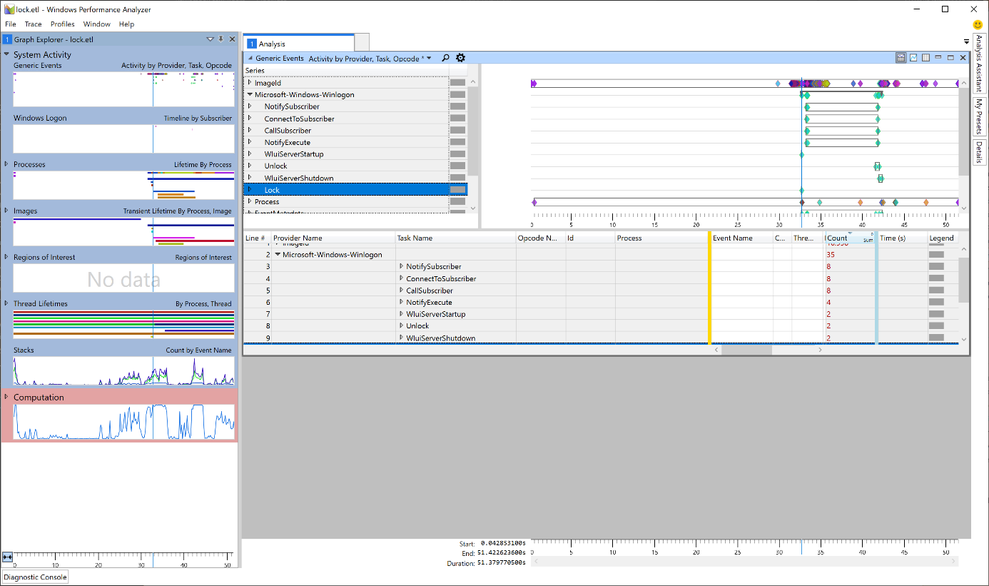
In WPA, I started with the Generic Events graph. Here we can find the event providers we traced next to the kernel trace (in our case the Microsoft-Windows-Winlogon provider).
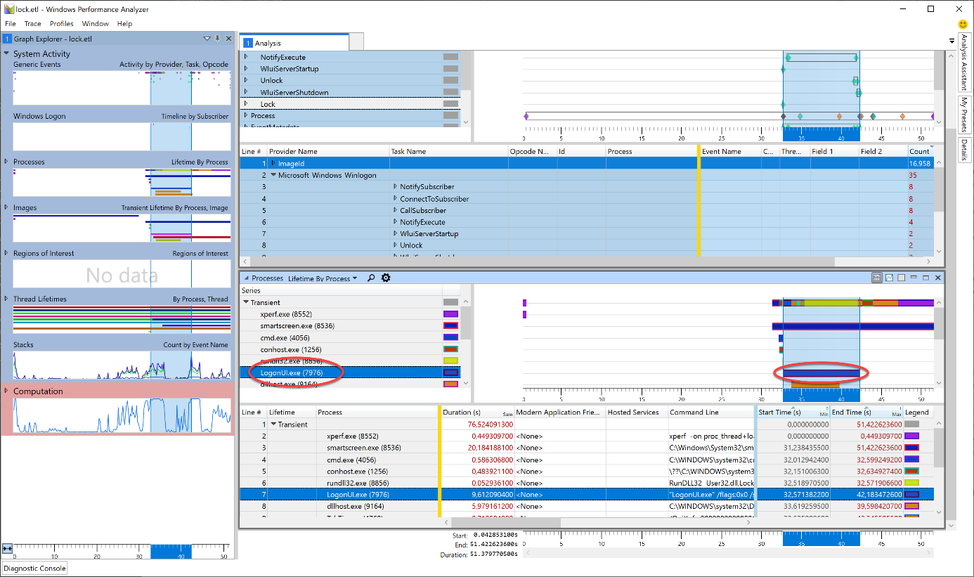
Taking a closer look, we can see that the Lock event is also part of the trace (Yeah, we caught the fish). Now, as we learned earlier, we know that a workstation lock triggers the LogonUI.exe process so I tried to find the start of this process in WPA. For this, I needed another graph: Lifetime by Process.
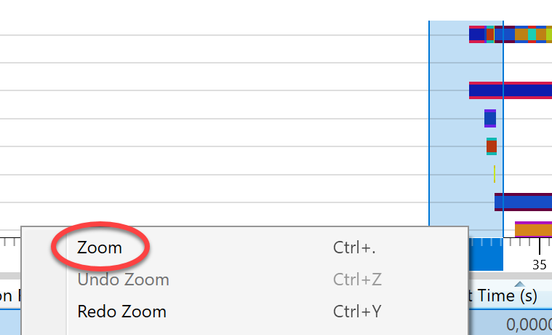
The image shows the LoginUI.exe process in the timeline. The call to the LockWorkStation function must have happened shortly before the LogonUI.exe process was created. To get rid of unnecessary information we Zoom to the area starting at approx. 3 seconds before and ending about a second after the start of LogonUI.exe. I highlighted those 4 seconds in the graph, right-clicked in the highlighted section and selected “Zoom”.
Somewhere in this section the call to LockWorkStation happens. The “Transient” process list showed five processes were started within those 4 seconds. But it’s possible that a process started earlier than this zoomed-in-view made the call to User32!LockWorkStation. The processes started before the beginning of the zoomed area, are grouped into the “Permanent” Lifetime.
To finally find the caller to LockWorkStation I need to search the stack of all running processes (Permanent and Transient) for the expression LockWorkStation. To do this, I added another graph to view the stack: CPU Usage (Sampled). This new graph automatically adopts to the zoomed timeline and only displays processes running in those 4 seconds.
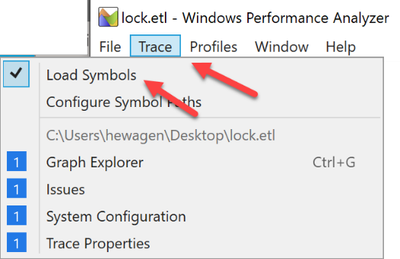
Now it’s time to load the debug symbols to. Otherwise we cannot search for the function name. I made sure that my PC had an Internet connection and, in the menu bar of the Windows Performance Analyzer, I clicked Trace -> Load Symbols. It could take a while when symbols are first loaded.
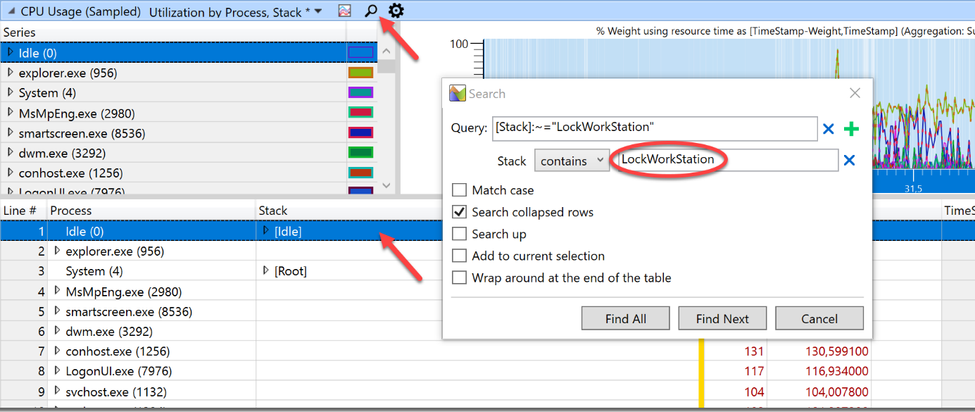
I highlighted the first line of the process table in the CPU Usage (Sampled) graph (to make sure to search all processes) and clicked on the small magnifier icon to open the search dialog. After that I clicked the three dots to expand the dialog and typed “LockWorkStation” into the field after “contains” (the query is constructed automatically so this box can be left empty).
Clicking “Find All” unmasked our culprit.
Rundll32.exe was quickly identified as the calling process. Handcuffs, conduct under escort. Case closed.

