This post has been republished via RSS; it originally appeared at: New blog articles in Microsoft Community Hub.
About year ago, we released the alert enrichment blog post covering a few new (at the time) capabilities in scheduled analytics rules.
The dynamic alert details section explained why and how we can set the name, description, severity and MITRE ATT&CK tactics.
This resulted in many users thinking to themselves – “why stop there?”
Why not allow customizing all the alert properties, making the alert investigation-oriented and minimizing the pivots to the raw events.
Microsoft Sentinel is a SIEM + SOAR solution and as such, it collects event log data from a range of sources including alert providers.
Alert providers are different since the detection logic is external, but by using Sentinel we can enhance and improve by applying enrichments, correlations, and automation on top of it.
In the following example we will show how we can apply correlation on alerts coming from Microsoft Defender for Cloud.
Note that the principles that we will show below can be applied on any alert provider, Microsoft and non-Microsoft alike.
Suspicious authentication activity
Microsoft Defender for Cloud is a Cloud Security Posture Management (CSPM) and Cloud Workload Protection Platform (CWPP) for all of your Azure, on-premises, and multi-cloud (Amazon AWS and Google GCP) resources.
One of the many detections found on Microsoft Defender for Cloud (MDC) is “Suspicious authentication activity”.
The “Suspicious authentication activity” detection indicates an attacker performing numerous authentication attempts using a dictionary of predefined account names and passwords in order to find valid credentials to access the host. This indicates that some of your host account names might exist in a well-known account name dictionary.
As you can easily tell from the description, we are likely to see a number of logon attempts which we would like to correlate.
Step #1: Enable the MDC connector
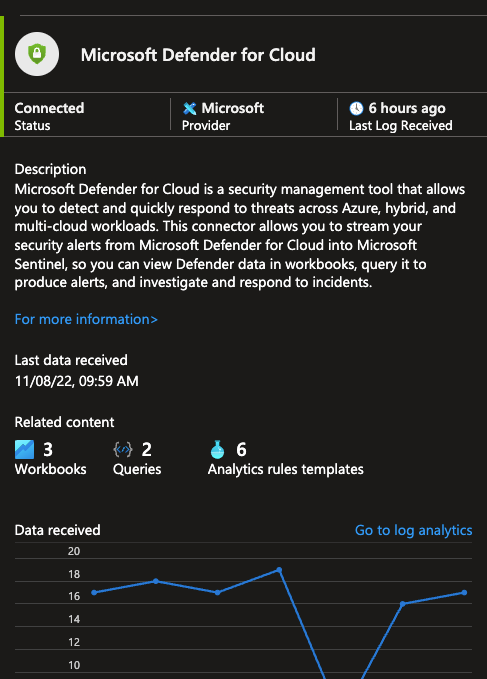
We will start by connecting the Microsoft Defender for Cloud connector into Sentinel.
After connecting the data connector, we will see that data has started flowing into our workspace.
Step #2: Create correlated incidents from MDC alerts
Each “Suspicious authentication activity” alert arriving at the workspace will have a host entity that indicates the resource our attacker wanted to log into.
We would like to correlate all alerts for the same host together.
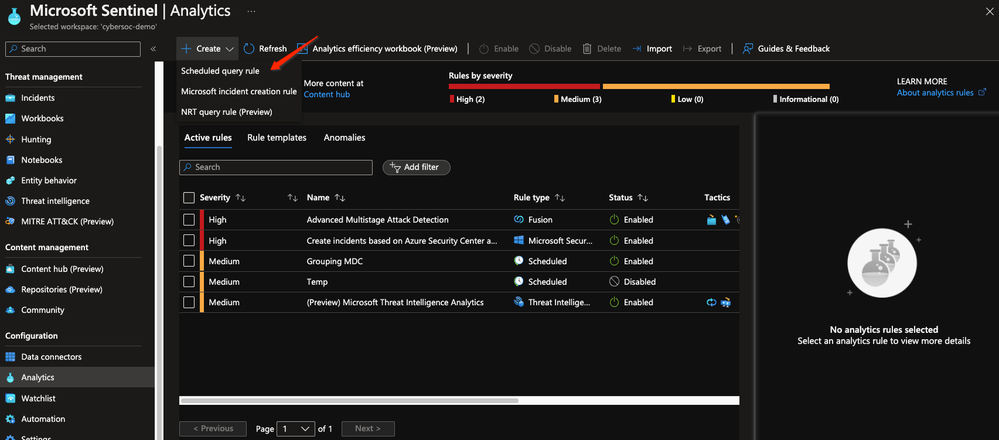
To do so we will start by creating a new scheduled analytics rule.
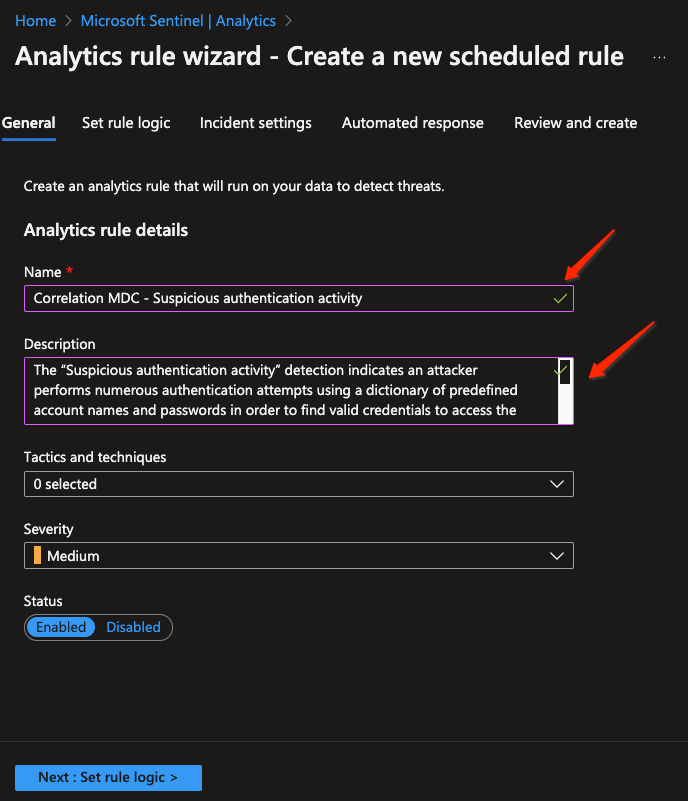
We will add a name and description to the new rule that will help us to know what the alert is all about.
Note that I am not setting the tactics, techniques and severity since all of these properties are going to be overridden later on in the detection.
Rule logic:
The query:
The query is pretty straightforward: we want to get all the “Suspicious authentication activity” alerts coming from Microsoft Defender for Cloud.
Note that since we are using KQL to create the incidents from the MDC alerts we can practically do everything we want – filtering, enrichments etc.
The entities:
Now we encounter our second challenge: the entities.
Entities are very important to the investigation process, and we would like to have the entities on the correlated incident.
Since parsing the entities JSON can be very challenging, we will use the ‘Sentinel entities’ mapping that will parse it automatically for us.
On the image we can see that we use the entities column as an input for the ‘Sentinel entities’ automatic parser.
The alert details:
Since we are creating the incidents using scheduled analytics rules, we will have many of the alert properties set to default values.
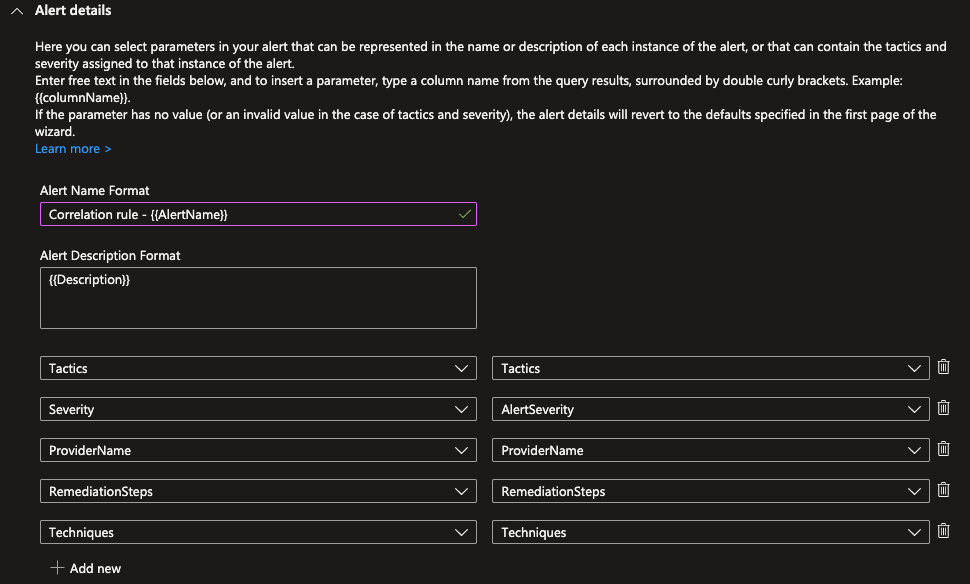
Now the original MDC alert had many properties that contain data essential for the investigation, such as name, description, Provider name and Remediation Steps.
We will use the dynamic alert details capability to map the missing data from the original MDC alert to the new alert we are creating.
Event grouping - Alert per row
Since we are working with alerts, we want each one of the query results to create a new alert that later on will be grouped together.
Correlation
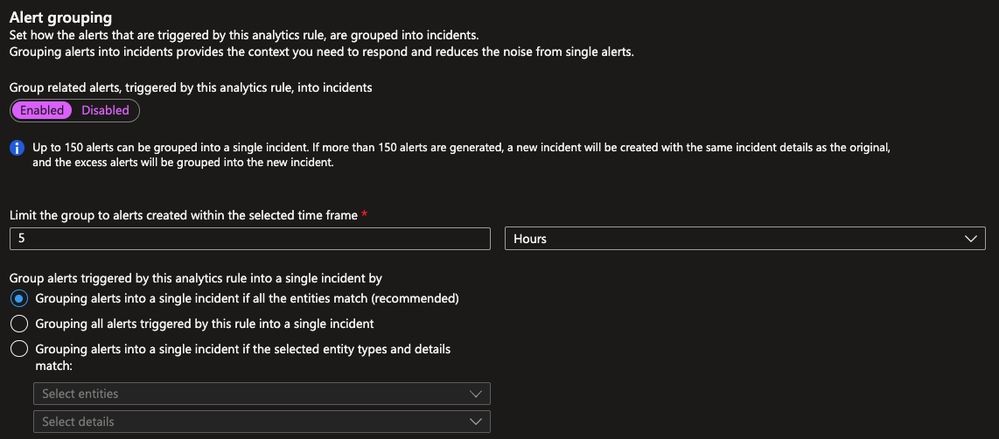
We want to correlate all alerts generated together with the same entities into a single incident.
To do so we will use the grouping configuration found on the analytics rules.
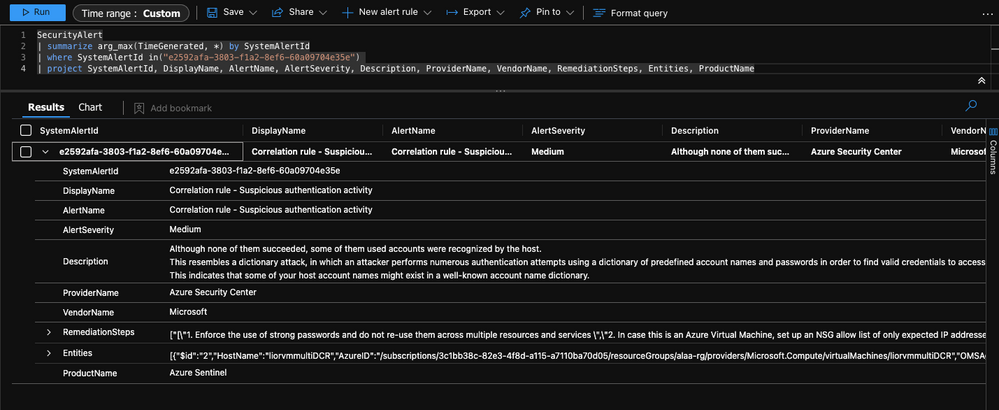
The alert
The alert created will have the newly set properties and some properties from the scheduled rules that we didn’t override.
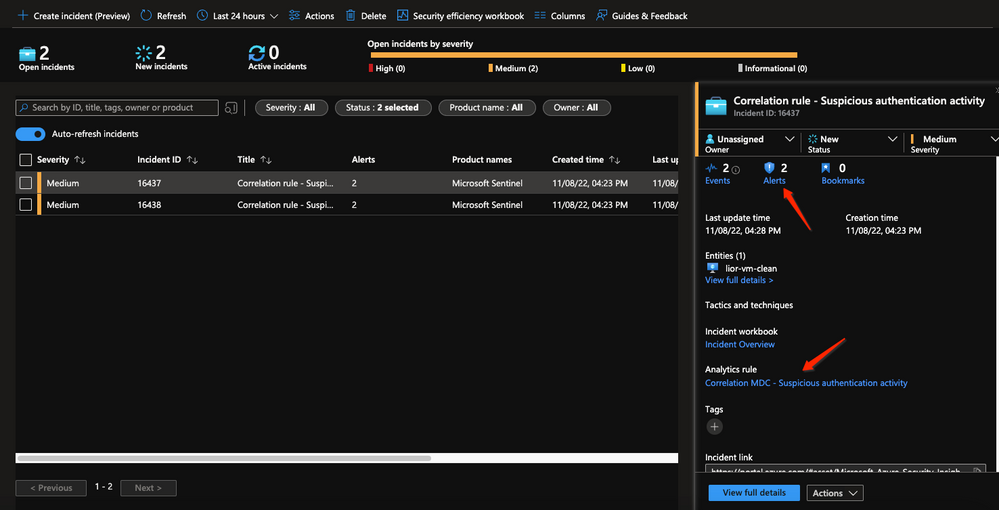
And we can see that the incident correlated multiple alerts by entities.
You can do a lot more with this!
In this blog post we covered how we can use the new dynamic alert properties for correlated alerts from Microsoft Defender for Cloud.
The fact that alerts now contain all required information for investigation will reduce the MTTR.
In this example we covered how we correlate MDC alerts, but dynamic alert properties can be used in multiple scenarios like non-Microsoft alerts correlation, enrichments, alert correlation and customizing alert properties.


